XAU USD Price Movement June 12 London Open: Bearish Momentum Targets $4,150
XAU USD price movement June 12 London open is shaping up as a textbook bearish continuation. After a short-lived bounce from $4,170 to $4,194, gold is now trading near $4,179 and losing ground fast. The hourly chart shows a rejection at the $4,200 area, with sellers stepping in aggressively to defend resistance. With the US dollar strengthening on renewed Iran peace deal doubts and hawkish Fed expectations, the path of least resistance remains lower. This setup alerts our AI Trading Bot to a potential short opportunity near $4,200 if price retests.
Want to trade this Gold setup automatically? Our AI Trading Bot runs 24/7 on XAU/USD with an 83%+ win rate.
Gold Market Overview
Gold is under pressure during the European session as the US dollar finds fresh bids. The PBOC set its daily USD/CNY reference rate at 6.8109, far weaker than the 6.7640 estimate, which underscores yuan depreciation and boosts the greenback. Combined with revived skepticism over the Iran peace deal, the dollar is attracting safe-haven flows that are toxic for gold. Hawkish Fed bets—fuelled by sticky inflation fears—add to the bearish cocktail, even though no high-impact US data is due today. The macro backdrop leaves XAU/USD vulnerable to further downside, with traders pricing in a more aggressive rate path.
Technical Analysis
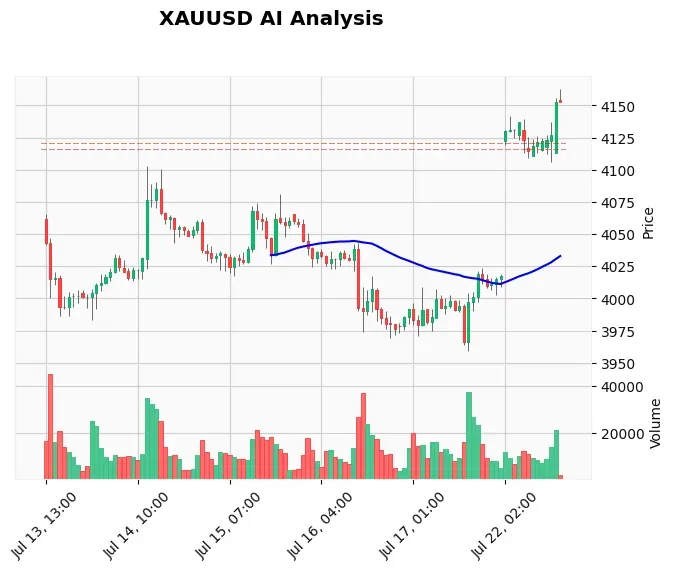
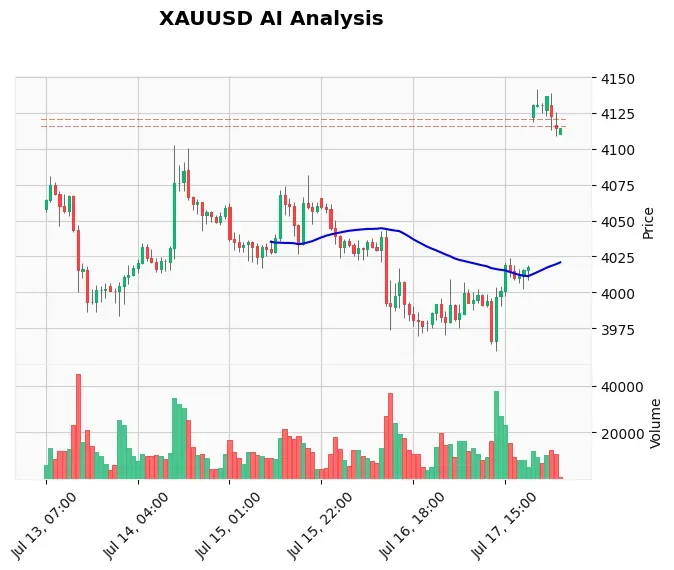
On the H1 chart, gold bounced from a session low of $4,170.12 to $4,194.38, but the move lacked conviction and quickly faded. The pair is now trading around $4,179.16, with M15 momentum clearly negative. The 20-period EMA sits at $4,168.94, just below current price, while the 50 EMA at $4,167.72 is almost converged—suggesting a bearish cross could accelerate the decline. The 200-period EMA at $4,300.32 remains far above, confirming the larger down-trend.
RSI(14) stands at 58.35, neutral but with plenty of room to fall before oversold territory. MACD is positive (19.18 vs. signal 18.03), but the histogram is narrowing, hinting at losing momentum. ATR is 27.82 points, reflecting elevated intraday volatility. Key levels to watch: resistance at $4,205.0 (prior reaction zone) and $4,232.0 (local swing high); support at $4,150.0 (recent swing low) and $4,130.0. A break below $4,170 would confirm a bearish continuation, targeting $4,150–$4,130.
Fundamental Drivers
Today’s price movement is heavily influenced by two factors. First, the PBOC’s unusually weak yuan fix signals a deliberate depreciation that lifts the DXY and depresses gold. Second, fading optimism around the US-Iran truce has revived dollar demand, as market participants reassess geopolitical risk. With no high‑impact US events on the calendar, the bearish narrative driven by Fed hawkishness and trade‑war fears dominates. For automated trading of such news‑driven moves, our News Trading Bot specializes in XAUUSD during high‑impact events.
Devil's Advocate
While the short bias is strong, traders must consider the bull case. If gold manages to reclaim and hold above $4,205, it could trap aggressive sellers and spark a squeeze towards $4,232. A daily close above $4,200 would challenge the bearish structure and invite a retest of the $4,300 area. However, as long as the US dollar remains bid and the Fed’s hawkish tone persists, such a recovery is unlikely. If the trend reverses unexpectedly, Cloud Copy Trading lets you mirror professional traders who adapt instantly.
Trading Strategy for This Session
Given the overwhelming bearish signals, our AI analysis has canceled the pending sell limit at $4,205 because the entry was too far from the immediate price action. Instead, the preferred strategy is to wait for a pullback to the $4,200–$4,205 zone to sell, with a stop loss above $4,235 and a target of $4,150. Alternatively, a breakdown below $4,170 can be used for a momentum entry with a stop above $4,194 and the same targets. To automate such price‑action setups, our Price Action Pro EA executes SMC‑based strategies on Gold with surgical precision.
Risk Management
With an ATR of $27.82, position sizing must account for wide swings. A 1% risk per trade rule suggests a stop loss distance of at least $28, meaning a short at $4,200 would require placing the stop around $4,228 to avoid noise. If the trade goes against you, do not add to losers; wait for a re‑entry signal. Always define risk before entering.
Frequently Asked Questions
Q: What is the key support for XAU/USD on June 12 London open?
A: The immediate support is $4,150, the recent swing low. A break below would target $4,130.
Q: Why is gold falling today in Europe?
A: A combination of US dollar strength from PBOC’s weaker yuan fix, hawkish Fed bets, and revived safe‑haven demand for the dollar due to Iran peace deal doubts is weighing on gold.
Q: What is the best entry for a short trade on XAUUSD now?
A: Our AI system suggests waiting for a pullback to $4,200–$4,205 to sell, or a break below $4,170 for a momentum entry.
Q: How does the RSI affect the gold price today?
A: RSI at 58.35 on the H1 chart indicates neutral conditions but provides room for further downside before reaching oversold levels.
Conclusion
XAU USD price movement June 12 London open confirms that bears are in control. The short‑lived bounce off $4,170 was just a pause, not a reversal. With resistance at $4,205 holding, the next leg lower seems imminent. Traders should stay disciplined, avoid chasing, and wait for a clean re‑entry near resistance or a break of support. Our AI Trading Bot remains on standby to catch the next high‑probability move without emotion.
Risk Disclaimer: Trading Gold (XAU/USD) involves significant risk of loss. This content is for informational purposes only and does not constitute financial advice. Always conduct your own research and trade responsibly.