Gold Slips Below $4,020 on Hawkish Fed Bets – XAUUSD Asian Session Outlook June 26
Gold tumbled through the $4,020 mark in early Asian trading on Thursday as traders digested a fresh wave of hawkish Federal Reserve commentary and robust US PCE inflation data. The XAUUSD Asian session outlook June 26 points squarely lower, with the precious metal now hovering near $4,012 after an overnight drop that broke several near-term supports. The mood across equity and rate markets has shifted firmly against gold, leaving bears in control of the short-term chart.
Want to trade this Gold setup automatically? Our AI Trading Bot runs 24/7 on XAU/USD with an 83%+ win rate.
Gold Market Overview
Early Asian liquidity is thin, but the bearish undercurrent that gripped New York on Thursday has rolled straight into Friday’s open. Gold is currently quoted near $4,012 – $4,015, pinned down by a combination of a surging US Dollar and rising Treasury yields. The DXY index pushed to fresh multi-week highs after Fed officials reinforced the “higher-for-longer” narrative, directly impacting the non-yielding metal.
New York Fed President Williams said the central bank’s 2% inflation target might not be reached until 2028, signalling that policy will stay restrictive for years. Meanwhile, Chicago Fed’s Goolsbee warned about labour-market risks but did not alter the broader hawkish tone. Market pricing for Fed rate cuts in 2026 has evaporated, and that has removed the primary bullish catalyst for gold.
With no major US economic data due until next week, the Asian session looks set to consolidate losses below the $4,030 pivot zone. Traders are watching the $4,000 psychological level, but the path of least resistance is clearly lower.
Technical Analysis
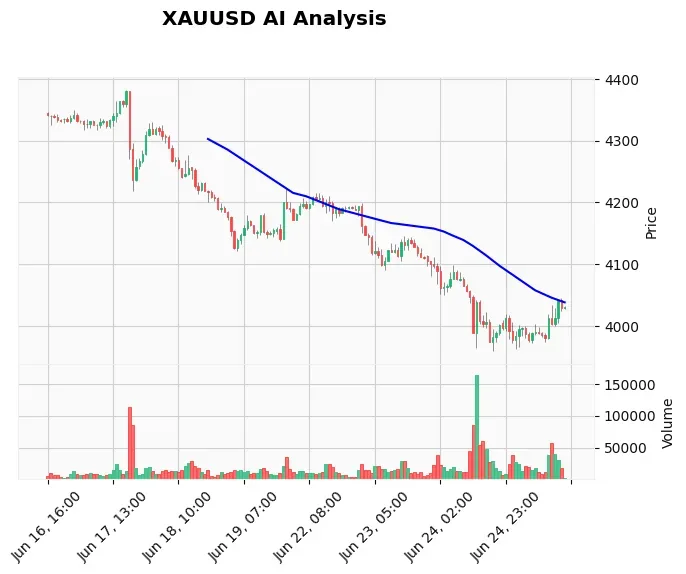
The daily chart presents a textbook bearish alignment. Price is trading well below the 50-day EMA ($4,036) and 200-day EMA ($4,150), with the latter sloping sharply lower. The RSI on the daily timeframe sits at a subdued 32.15, and the H4 RSI at 35.9, both in bearish territory but not yet oversold, leaving room for further declines.
On the hourly chart, the EMA stack is firmly short: 20 EMA at $4,016, 50 EMA at $4,036, and the 200 EMA far above at $4,150. The ADX reading of 25.7 confirms a developing bearish trend, even if the DI+/DI- spread is still narrow. Momentum indicators on the 15-minute chart show a mild bullish pop in MACD histogram, but price has already been rejected at the 20 EMA, confirming the intraday downtrend.
Key support levels from the latest webhook data include pivot S1 at $3,959.08, which aligns closely with the AI signal’s final take-profit target at $3,963. That zone is the next major floor. Immediate resistance stands at VWAP ($4,023.73) and the prior day’s high at $4,044.14. The ATR of 21.11 points to elevated volatility, meaning stops must be placed with care. Use our Gold technical analysis tools to confirm levels in real time.
Fundamental Drivers
The core driver behind gold’s slide is the repricing of Fed expectations following Thursday’s US PCE inflation data. Core PCE came in line with estimates, but the details reinforced the view that inflation is sticky enough to keep the Fed on hold indefinitely. Headlines from FXStreet and Investing.com both highlighted that “gold declines below $4,050 as US PCE inflation supports Fed hike bets.”
A separate wave of USD strength pushed gold beneath the $4,000 mark for the first time since November 2025, as interest-rate differentials swung sharply in the greenback’s favour. Google News sources also pointed to a “dollar surge pushes gold below $4,000 amid rate hike bets,” underlining the macro headwind.
While no high-impact events are scheduled for the next few hours, the news flow remains overwhelmingly negative for gold. For those who trade the news, our News Trading Bot capitalizes on high-impact events and can turn these macro moves into automated profits.
Devil’s Advocate
The bearish thesis is built on a rock-solid combination of technical structure and hawkish fundamentals, but no trade is foolproof. A surprise shift in tone from a Fed speaker or an unexpected geopolitical headline could spark a short squeeze. The key level to watch on the upside is the $4,036-$4,044 region, which houses the hourly EMA50 and the prior day’s high. A decisive break above that zone would invalidate the immediate bearish bias and could open a path toward $4,062. However, with the macro backdrop as strong as it is, any such bounce would likely be short-lived.
Trading Strategy for This Session
The highest-probability trade is to sell into intraday strength. The AI analysis log recommends a market sell around $4,012.41, with a stop loss at $4,032.00 (just above the day’s high) and a take-profit ladder at $3,992, $3,975, and $3,963. Given the ATR of 21.11, a 20‑point stop provides a sensible buffer against noise while keeping risk in check.
For traders who prefer a limit entry, a sell limit near the VWAP level of $4,023.73 would offer a better risk‑reward ratio, though bullish momentum is thin and such a pullback may not materialize. For precise execution, traders can use our Price Action Pro EA to automate these levels risk-free.
Risk Management
Position sizing is critical when trading a volatile 24‑hour asset like XAUUSD. With a $20 stop loss, risking no more than 1‑2% of capital per trade is standard practice. A $1,000 account would withstand a 50‑pip stop comfortably with a 0.02 lot size. The risk‑reward ratio for this setup, targeting $3,992 as the first objective, sits near 1:1, while the extended target at $3,963 offers roughly 1:2.5, providing a cushion for partial scaling out. If the trade moves against you, cut it quickly; no single session trade matters more than your long‑term equity curve.
FAQ
What is the XAUUSD outlook for the Asian session on June 26?
The outlook is decidedly bearish. Technical indicators across daily, H4 and H1 charts align with a hawkish Fed backdrop to push gold lower. The immediate bias is for a test of support at $3,975, with a possible extension to $3,959.
What are the key support and resistance levels for XAUUSD today?
Key support rests at $3,959.08 (pivot S1), with psychological support at $4,000. Resistance levels are at $4,023.73 (VWAP), $4,036.40 (EMA50), and $4,044.14 (prior day’s high).
Why is gold dropping so sharply?
Gold is falling because US PCE inflation data and hawkish Fed commentary have strengthened the US Dollar and pushed rate-cut expectations out to 2028. A firmer dollar and higher real yields reduce the appeal of non‑yielding gold.
What stop loss should I use for a gold short trade today?
A stop loss above $4,032.00 is prudent. That level sits above the day’s high and hourly EMA50, giving the trade room to breathe while protecting against a sharp reversal.
Conclusion
The $4,000 round number will be the session’s psychological battleground, but bears hold the upper hand. A clean break below that barrier could accelerate the decline into the $3,975 and $3,959 support cluster. As long as price stays beneath the $4,036 zone, sell‑on‑strength strategies remain favoured. If you’re ready to take advantage of Gold’s next move, grab our live Gold trading signals and stay ahead.
Risk Disclaimer: Trading Gold (XAU/USD) involves significant risk of loss. This content is for informational purposes only and does not constitute financial advice. Always conduct your own research and trade responsibly.