XAUUSD Asian Session Outlook April 13: Bulls Guard $4,729
Gold is trading quietly near $4,740 in the early Asian hours this April 13, with bulls working to defend the critical 20-day Exponential Moving Average at $4,729. The XAUUSD Asian session outlook April 13 is defined by a technical standoff between immediate bullish momentum and looming fundamental risk, setting the stage for a potentially volatile European and US session later today. Price action is consolidating after a significant rally, and the market's next major move hinges on the upcoming US Producer Price Index data. Want to navigate this high-stakes environment without emotional strain? Our AI Trading Bot executes precise XAU/USD strategies 24/7, capitalizing on such setups with an 83%+ win rate.
Gold Market Overview
The market sentiment for Gold is cautiously neutral as the Asian session unfolds. The US Dollar Index (DXY) is finding minor bids on safe-haven flows following the collapse of US-Iran peace talks, which typically pressures gold. However, this same geopolitical tension is providing a direct bullish tailwind for the precious metal as a traditional safe-haven asset, creating a conflicting dynamic. The primary macro theme is the inflation-risk narrative, spurred by a sharp rebound in Crude Oil prices back above the $100 per barrel mark. This spike in energy costs is stoking fears of persistent inflationary pressures, which could force the Federal Reserve to maintain a restrictive policy stance for longer—a fundamental headwind for non-yielding gold. Traders are largely on the sidelines, preserving capital ahead of the high-impact PPI release due in the US session.
Technical Analysis
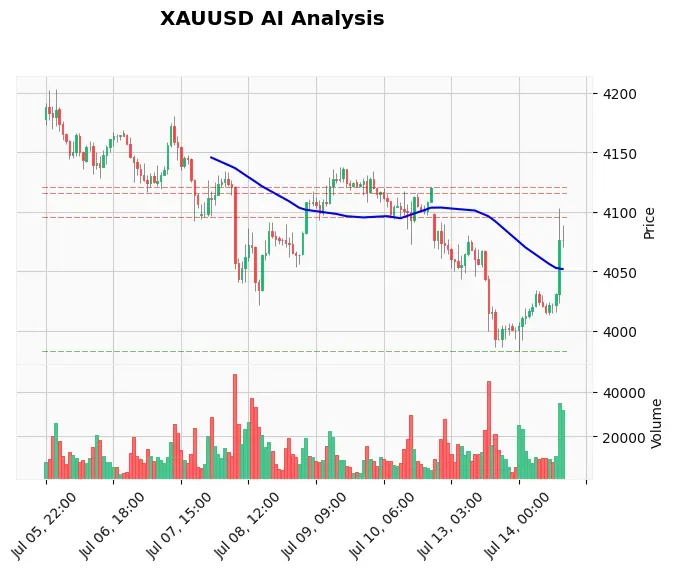
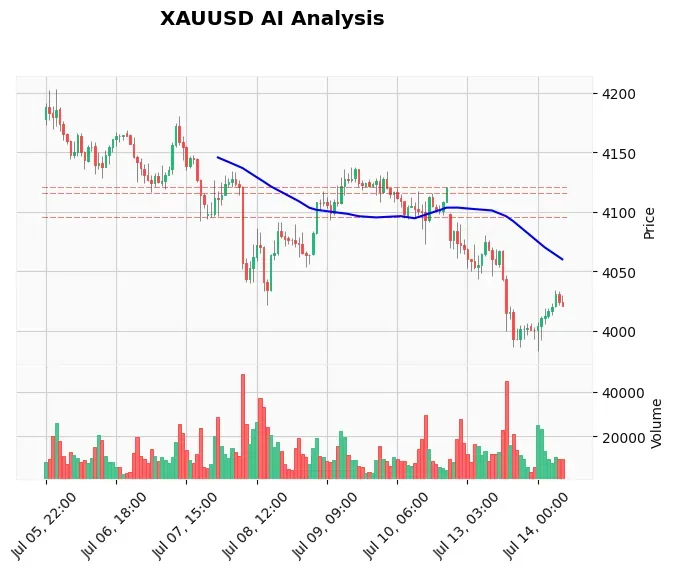
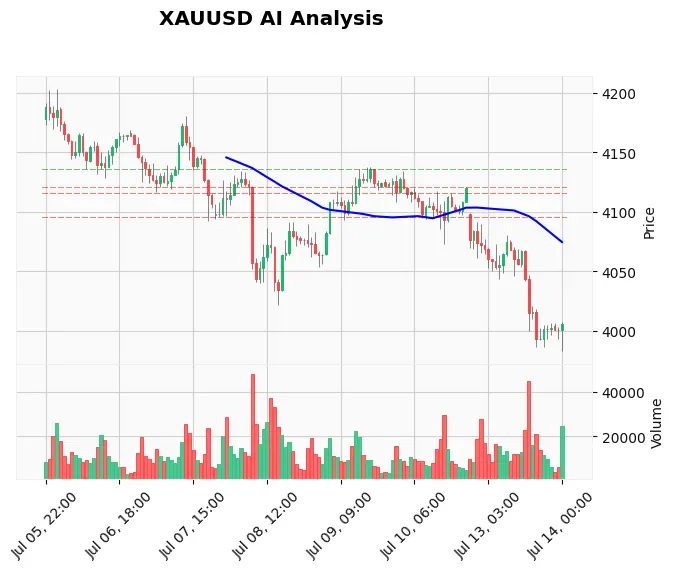
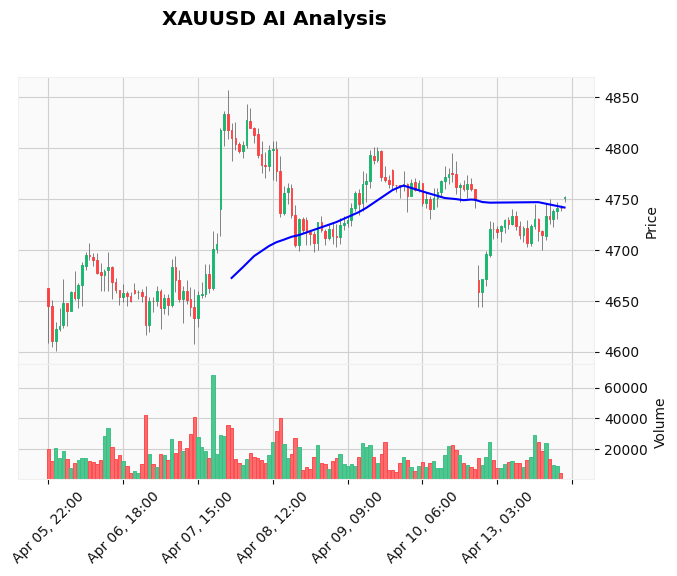
The daily chart presents a mixed picture. Price is currently sandwiched between the EMA 20 at $4,729.16 and the EMA 50 at $4,779.37, indicating a short-term consolidation within a broader bullish structure (the EMA 200 sits far below at $4,274.33). The immediate support to watch is the EMA 20 at $4,729; a sustained break below could trigger a deeper pullback toward the $4,600 zone. Resistance is far away, with R1 at $5,419.15. The RSI reading of 49.06 is perfectly neutral, offering no directional bias. The MACD histogram, while still negative at -49.98, is converging toward its signal line (-80.24), suggesting bearish momentum may be waning. The Average True Range of 156.65 points signals elevated daily volatility, warning traders to expect large swings. The chart structure favors buying dips toward the EMA 20 support, but the extended move higher calls for patience.
Fundamental Drivers
Two key drivers dominate the fundamental landscape. First, the geopolitical shock from the failed US-Iran negotiations has injected a fresh wave of uncertainty. This supports gold as capital seeks safety, but it also complicates the inflation outlook by driving energy prices higher. Second, and most critical for today, is the imminent release of US Producer Price Index (PPI) data. Forecasts point to a monthly increase of 1.1% for headline PPI and 0.4% for the core reading. A hotter-than-expected print will likely turbocharge the US Dollar as traders price in a more hawkish Fed, triggering a sharp sell-off in gold. Conversely, a cooler print could relieve pressure and allow gold bulls to reassert control. Navigating such high-impact news requires split-second execution, which is where our News Trading Bot excels, automatically trading the volatility surge from events like PPI.
Devil's Advocate
While the intraday trend is bullish, a compelling bearish scenario exists. The rally from the $4,644 low appears extended on lower timeframes, increasing the risk of a technical correction. Fundamentally, if the PPI data significantly exceeds forecasts, it could validate the market's worst fears about sticky inflation. This would lead to a rapid repricing of Fed rate expectations, sending Treasury yields and the US Dollar soaring—a classic negative cocktail for gold prices. Such a move could see XAUUSD swiftly break below the EMA 20 support at $4,729 and target the recent swing low near $4,644. The bearish case is entirely contingent on a hawkish data surprise, reminding traders that the current bullish structure is fragile.
Trading Strategy for This Session
Given the extended price action and the proximity of a major economic release, the most prudent strategy for the Asian and early European session is to WAIT. The optimal approach is to let the market digest the PPI news and then trade the confirmed directional breakout. For those seeking a pre-event setup, only a deep pullback to the $4,700-$4,715 demand zone would offer a favorable long entry with a tight stop below $4,644, targeting a retest of $4,780. However, carrying such a position through the PPI release carries substantial event risk. A more systematic approach is to use a robot that can manage this volatility; our Price Action Pro EA is built to identify and trade such high-probability pullbacks within a strong trend using smart money concepts.
Risk Management
Event-driven sessions demand stricter risk protocols. Position sizing should be reduced by at least 50% compared to normal conditions due to the elevated ATR and potential for gap moves. Any trade taken before the PPI must have a stop-loss order firmly in place. The key risk-reward principle is to avoid setups where the potential reward does not at least double the assumed risk. If a trade moves against you quickly, do not average down—honor your initial stop. The period immediately after the data release often sees erratic price spikes; avoid market orders and use limit orders to enter at predefined levels. For hands-off risk management, consider a low-latency Windows VPS to ensure your stops and limits are executed without delay, 24 hours a day.
Frequently Asked Questions (FAQ)
Q: What is the key support level for gold (XAUUSD) today?
A: The most important immediate support is the 20-day Exponential Moving Average (EMA) at $4,729. A daily close below this level could signal a deeper correction toward the $4,600 area. The secondary support is near the recent swing low at $4,644.
Q: How will the US PPI data affect gold prices?
A: The PPI data measures wholesale inflation. A higher-than-expected reading is bearish for gold, as it implies persistent inflation, likely keeping the Federal Reserve hawkish and strengthening the US Dollar. A lower-than-expected reading is bullish, as it eases Fed pressure and could weaken the Dollar.
Q: Is the bullish trend for gold still intact?
A: On the higher timeframes, yes. The price remains well above the long-term 200-day EMA at $4,274. However, on the daily chart, the trend has turned neutral as price consolidates between the 20-day and 50-day EMAs. The reaction to the PPI data will be crucial for determining the next sustained directional move.
Q: What is a good strategy for trading gold around high-impact news?
A: The safest strategy is to wait for the news release to pass and the initial volatility spike to settle—usually 15-30 minutes after the announcement. Then, trade the confirmed breakout from the pre-news range or a retest of the new support/resistance level that forms. Using automated tools like a specialized news bot can also capture these moves effectively.
Conclusion
The Asian session serves as a calm before the storm, with gold pivoting around the $4,740 level. The battle line is drawn at the $4,729 EMA 20 support, with the upcoming PPI data acting as the potential catalyst for the next significant leg. Traders should prioritize capital preservation and clear level recognition over aggressive positioning in this environment. The market will provide a clearer directional signal once it absorbs the fundamental shock. For consistent results in such conditions, automating your strategy with our best-selling AI Trading Bot removes emotion and executes a disciplined, backtested approach to Gold trading, whether the market breaks up or down from this critical juncture.
RISK DISCLAIMER
Trading Gold (XAU/USD) involves significant risk of loss. This content is for informational purposes only and does not constitute financial advice. Always conduct your own research and trade responsibly. Past performance is not indicative of future results.