XAUUSD Asian Session Outlook April 06: $4,625 Support Tested, $4,680 Target
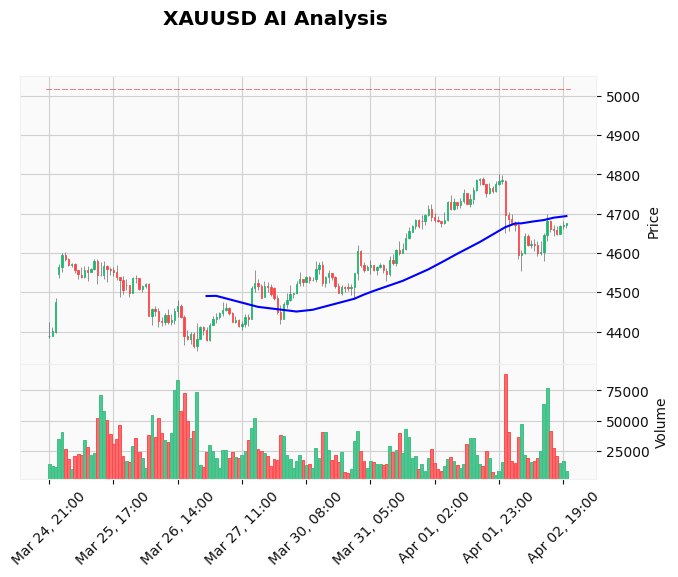
Gold is holding steady just above the $4,625 support level in the quiet Asian session this Monday, April 06. The XAUUSD pair is trading at $4,635, having bounced from an overnight low of $4,625.34, a level that now acts as the immediate battleground between bulls and bears. This price action confirms the 100-day Simple Moving Average as a formidable support zone, setting the stage for a potential push towards the $4,680 resistance in the coming sessions. For traders looking to capitalize on this defined range, our AI Trading Bot is designed to execute such precise setups with disciplined risk management, operating 24/7 on the XAU/USD pair.
Gold Market Overview
The Asian session is characterized by patient consolidation as the market digests Friday's moves and positions itself ahead of the week's key US data. The US Dollar Index (DXY) is relatively flat, allowing gold to find its footing after a minor gap lower at the weekly open. Sentiment is cautiously optimistic, underpinned by the successful defense of the critical $4,615-$4,625 support confluence. While broader headlines point to rising Fed rate hike bets which typically pressure gold, the metal is demonstrating resilience, suggesting underlying bids from geopolitical tensions are providing a floor. This creates a classic tug-of-war scenario that often precedes a directional breakout, making session analysis crucial. For daily insights into these market shifts, many professionals follow our live Gold trading signals.
Technical Analysis
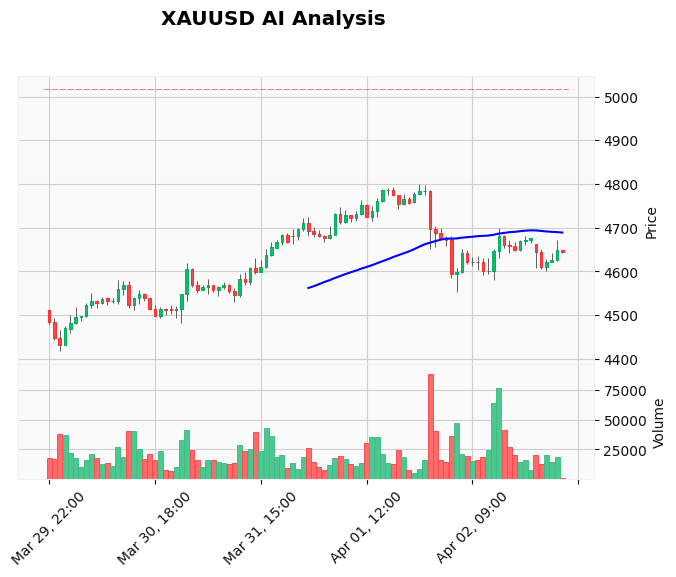
The hourly chart paints a clear picture: a bullish recovery from a precise test of the 100-day SMA and the S1 support at $4,625.34. Price is now contending with the 20-period Exponential Moving Average (EMA) at $4,658.5, with the 50-period EMA at $4,702.3 acting as a more significant hurdle overhead. The immediate resistance to watch is R1 at $4,648.09; a sustained break above this could accelerate a move towards the $4,680 zone. The Relative Strength Index (RSI) at 44.2 shows room for upward momentum before hitting overbought territory. The Moving Average Convergence Divergence (MACD) remains in negative territory but its histogram shows signs of convergence, hinting at weakening downward momentum. The Average True Range (ATR) of 22.75 points indicates moderate volatility, suitable for swing trades. The primary support structure is firm at $4,625 (S1) with a secondary safety net at $4,580 (S2).
Fundamental Drivers
The fundamental spotlight today falls squarely on the US ISM Services PMI, released during the US session. The forecast of 54.8, down from the previous 56.1, suggests a potential cooling in the dominant services sector. A significant miss below 54.0 could trigger a USD sell-off, providing a direct boost to gold prices. Conversely, a strong beat could reinforce hawkish Fed expectations and test gold's support structure once more. Later in the week, the FOMC Meeting Minutes and Core PCE Price Index data will dictate the broader trend. Geopolitical noise, particularly surrounding US-Iran tensions, continues to provide a latent bid for gold as a safe-haven asset. Navigating these high-impact events manually is challenging, which is why tools like our News Trading Bot are engineered to parse and react to such data releases instantly.
Devil's Advocate
While the bounce from $4,625 is technically encouraging, the bearish case remains valid. The price is still trading below both the 20 and 50-period EMAs on the hourly chart, and the primary trend from the webhook data is labeled "short." The MACD line is still well below its signal line. If the ISM Services PMI data comes in surprisingly hot, it could fuel another leg of USD strength, potentially breaking the $4,625 support. A daily close below $4,615 (the 100-day SMA area) would invalidate the current bullish recovery thesis and expose the next major support at $4,580. Bulls must reclaim the $4,650-$4,660 zone to regain control.
Trading Strategy for This Session
The strategy for the Asian and early European session is to look for long entries on a retest of the support confluence between $4,625 and $4,630. This aligns with the AI log's identified setup. An entry in this zone with a stop loss placed just below the 100-day SMA at $4,614 offers a favorable risk-reward ratio. The primary take-profit target is the recent swing high and resistance area at $4,680. A more ambitious secondary target lies at $4,750, which would come into play on a sustained break above $4,680. This is a classic "buy the dip" setup within a larger bullish trend. For traders who prefer automated execution of such support-based strategies, our Price Action Pro EA specializes in identifying and trading these order block and liquidity setups on XAUUSD.
Risk Management
Position sizing is critical when trading near key support. Risk no more than 1-2% of your capital on this single setup. The stop loss at $4,614 defines the risk per ounce. If the trade moves in your favor, consider moving the stop loss to breakeven once price breaches the $4,650 level, effectively removing the trade's risk. The initial risk-to-reward ratio targeting $4,680 is approximately 1:3, which is excellent. If the trade fails and the stop is hit, step aside and wait for price to either reclaim the level or target the next support at $4,580. Discipline in accepting small losses is what preserves capital for the next opportunity. For a hands-off approach to risk-managed trading, consider our Cloud Copy Trading platform, which mirrors the trades of experienced professionals.
Frequently Asked Questions (FAQ)
Q: Where is the key support for gold (XAUUSD) today?
A: The most critical support zone is between $4,615 and $4,625, which encompasses the 100-day Simple Moving Average and the recent swing low. A break and close below this area would shift the short-term bias to bearish.
Q: What is the main event driving gold prices on April 06?
A: The US ISM Services PMI data, released at 14:00 UTC, is the primary driver. A weaker-than-expected reading (below 54.0) could boost gold, while a stronger number could pressure it back towards support.
Q: Is the overall trend for gold still bullish?
A: The longer-term daily chart trend remains bullish as price holds well above the 200-day EMA at $3,980. However, the short-term hourly trend is corrective/neutral, with price consolidating between $4,625 support and $4,680 resistance.
Q: What is a good target if gold breaks above $4,650?
A: The first significant target is the recent high and resistance area at $4,680. A confirmed break above that opens the path towards the $4,750 level, which is the next major technical hurdle.
Conclusion
The Asian session has set a clear technical framework: defend $4,625 and aim for $4,680. The successful bounce from the 100-day SMA confirms this level as a magnet for buyers. All focus now turns to the US ISM data, which will provide the fundamental catalyst for the next directional move. The current setup favors looking for long opportunities on dips, with a well-defined invalidation level below $4,615. Trading this environment requires patience and precision—two qualities systematically applied by our best-selling Gold trading bot, which analyzes support, resistance, and momentum in real-time to execute high-probability trades.
Risk Disclaimer: Trading Gold (XAU/USD) involves significant risk of loss. This content is for informational purposes only and does not constitute financial advice. Always conduct your own research and trade responsibly.