XAUUSD Asian Session Outlook June 16: $4,340 Next?
Monday’s violent rally tore through weeks of sideways chop. Gold rocketed more than 3% after the US and Iran announced a framework peace deal, crushing crude oil and washing away lingering rate‑hike fears. The XAUUSD Asian session outlook June 16 begins with the price camped just below the $4,320 handle—and with the breakout now confirmed, the only question left is how quickly bulls can press toward $4,340. Whether you are already long or waiting for a clean pullback, the chart is speaking clearly: trend momentum is in charge. For traders who prefer systematic execution, our AI Trading Bot has already adjusted stops to breakeven and is targeting the very same level this article outlines.
Gold Market Overview
Asian desks opened to a dramatically different macro landscape. The US‑Iran accord pushed WTI crude sharply lower on Monday, slicing inflation expectations and tilting the Federal Reserve’s probable path from “one more hike” to “hold and watch.” The US Dollar Index fell to a ten‑day low, giving gold its strongest tailwind in weeks. With the FOMC decision just 42 hours away, traders are already betting that Chair Powell will reinforce the newly dovish narrative—an outcome that would further erode real yields and keep safe‑haven flows directed at gold.
Sentiment is exuberant. Barclays published a note calling for gold to reach $4,900 over the medium term, and Monday’s price action did little to temper that enthusiasm. Still, early Asian trading is showing a natural pause: after a 3% single‑day surge, consolidation near $4,315–$4,320 is healthy. The key now is whether buyers can hold the overnight range and avoid a deeper retracement that would question the breakout’s validity.
Technical Analysis
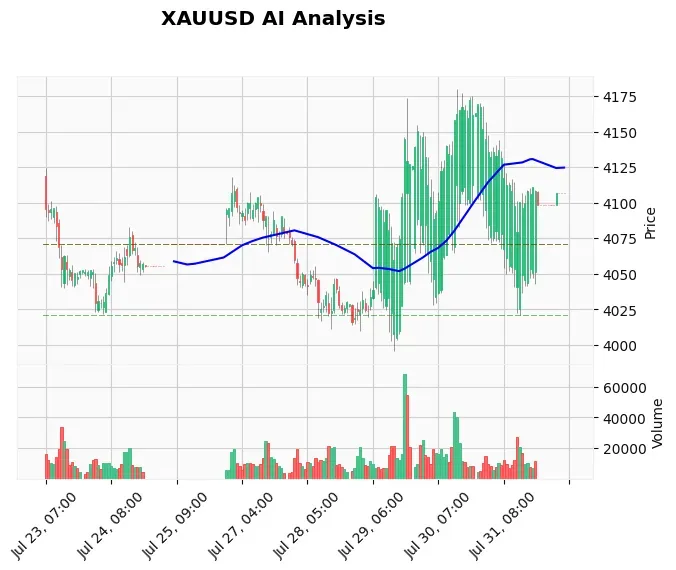
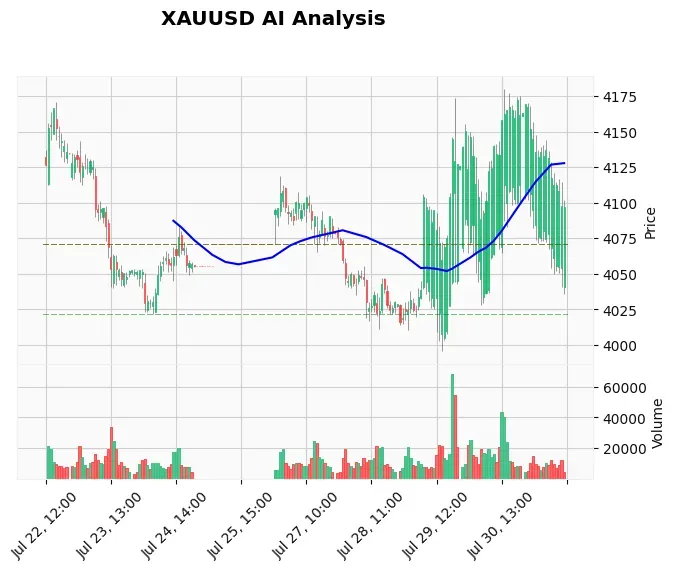
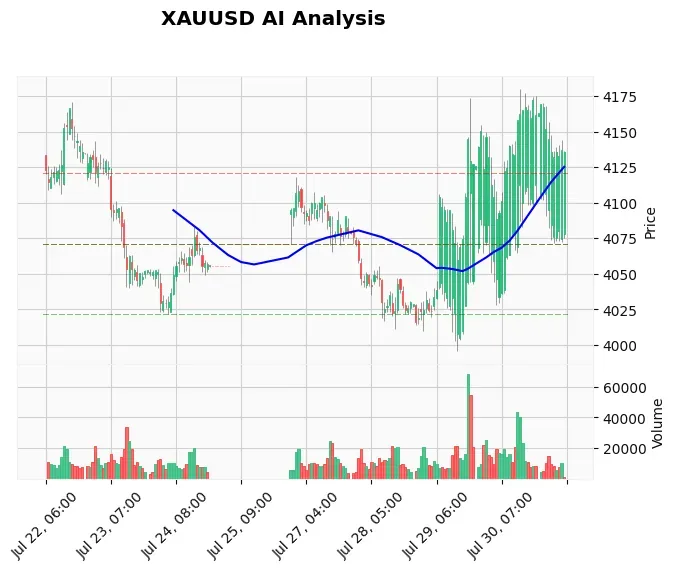
The 1‑hour chart tells a textbook bullish story. A multi‑day consolidation triangle was decisively broken to the upside, with Monday’s close at $4,319.38 leaving price well above all major moving averages. The 20‑period EMA sits at $4,316.74, the 50 at $4,276.25, and the 200 at $4,297.55—a rising ladder that confirms bullish structure from the short‑term to the intermediate trend.
RSI registered 56.02 at the time of this analysis, comfortably above 50 but nowhere near overbought territory, leaving ample room for further gains. MACD (14.51) remains below its signal line (22.77), which hints at a mild loss of short‑term momentum. Yet this is common after a breakout thrust and does not signal reversal as long as price stays above the breakout zone. Daily ATR stands at $17.33, meaning a $17‑to‑$20 range can be expected in any normal session—giving bulls a realistic path to the first key resistance at $4,340 (the initial extended target from our AI log) and, beyond that, the webhook‑derived R1 at $4,363.54.
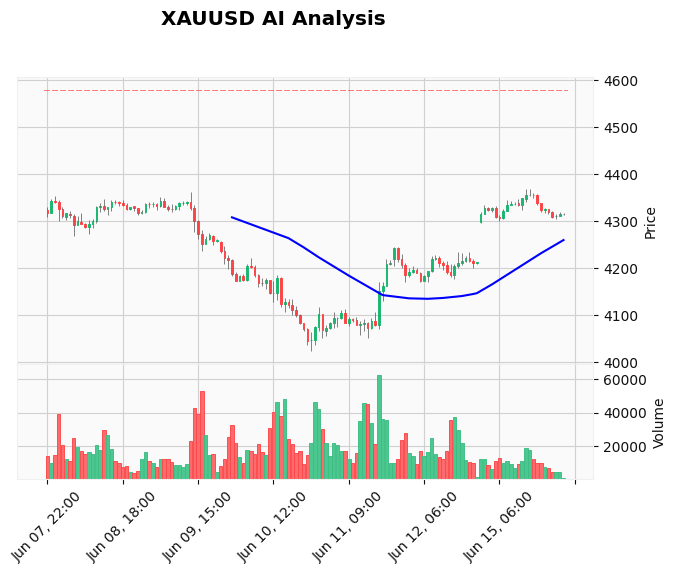
On the downside, the immediate support is the overnight low of $4,306.78, with the psychological and structural level at $4,300—the top of the former triangle—acting as the floor. A deeper pullback would need to break $4,268.53 (S2) to threaten the broader uptrend, a scenario that looks unlikely without a hawkish FOMC shock.
Fundamental Drivers
The narrative has flipped. Just one week ago inflation was enemy number one; now a peace deal that slashes energy costs has given the Fed room to pause. Markets are pricing in a hold at 3.75%, and with no change expected, the accompanying statement and economic projections will be parsed for any hint of future easing. Goldman Sachs and Barclays both noted that the Iran‑driven oil correction removes a major upside risk to CPI, which in turn keeps the dollar soft and gold supported.
Geopolitically, the agreement is a net positive for risk appetite—but gold is gaining not because of fear, but because of the monetary policy repricing. That’s a powerful shift: gold is acting as an investment asset, not a panic hedge. For traders who want to automate news‑driven opportunities, our News Trading Bot is built to execute on precisely these kinds of high‑impact macro events.
Devil’s Advocate
Every breakout has two faces. If the FOMC surprises with a hawkish dot plot—perhaps median rate projections showing another hike in Q3—the US dollar could snap back viciously, and gold would likely tumble toward the 200‑period EMA near $4,297. A daily close below $4,300 would invalidate the triangle breakout and shift the bias back to neutral. In that scenario, the longer‑term support at $4,268.53 becomes the first real demand zone for swing buyers.
For now, the probabilities lean in favor of the bulls, but respecting the “what if” keeps accounts alive. No position should be large enough to survive a black‑swan outcome.
Trading Strategy for This Session
The highest‑probability play remains the one our AI models are already executing: protect the existing long. With the stop‑loss raised to $4,312 (breakeven on the latest entry), traders are protected against a sudden fade while keeping profit exposure intact. The take‑profit target is extended to $4,340, a level that aligns with the next minor resistance and offers approximately a 1.6‑to‑1 reward‑to‑risk ratio from the current price area.
Aggressive traders who missed the initial surge may consider light entries on a dip to $4,308–$4,312, but only if that zone holds as support. As always, automated tools can remove emotion from these decisions. The Price Action Pro EA is one solution that trades XAUUSD using smart‑money concepts, identifying entries based on the same order‑block logic many professional desks rely on.
Risk Management
A 0.73 ATR stop (roughly $12) is a tight but workable buffer below $4,320. Given the daily ATR of $17.33, a stop at $4,312 leaves enough wiggle room for normal volatility. Position sizing should follow the 2% rule: no more than 2% of account equity at risk per trade. Ahead of a major central bank decision, however, even 1% risk is prudent. If the trade moves against you and the stop is hit, step back and let the FOMC dust settle before re‑engaging.
Frequently Asked Questions
- Is gold a buy today?
- The short answer: only on pullbacks that hold above $4,300. The breakout is fresh and the fundamental backdrop is supportive, but chasing price at the highs of an Asian session is risky. A measured approach—buying dips to $4,312 with stops below $4,300—offers better risk/reward.
- What is the target for XAUUSD this week?
- The immediate upside objective is $4,340, followed by $4,363. Should the FOMC statement confirm a dovish hold, a weekly close above $4,363 would open the door to $4,500+ in the coming sessions.
- How will the FOMC meeting affect gold prices?
- If the Fed stays on hold and hints at no further hikes, gold should rally as real yields fall and the dollar weakens. A hawkish surprise—perhaps a rate hike or a sharply higher dots plot—would be the main risk, pushing XAUUSD down to at least $4,297 or $4,268.
- What are the key support and resistance levels for gold today?
- Support rests at $4,306.78 (overnight low) and $4,300 (breakout level). Resistance lies at $4,340 (short‑term target) and $4,363.54 (daily R1). A break above $4,363 would signal a continuation toward $4,515.48.
The only number that matters today is $4,300. As long as gold trades above this threshold, the dominant trend is higher, and every dip is a potential opportunity. The countdown to Wednesday’s FOMC means volatility is guaranteed, but the underlying thesis—a dovish Fed, a weak dollar, and a re‑priced inflation outlook—favors the bulls. We are in a market where conviction meets confirmation; the challenge is not identifying direction, but executing with discipline. For traders who want to stay on the right side of this move without staring at screens, our AI Trading Bot manages the heavy lifting around the clock—so you don’t miss the next breakout.
Risk Disclaimer: Trading Gold (XAU/USD) involves significant risk of loss. This content is for informational purposes only and does not constitute financial advice. Always conduct your own research and trade responsibly.