XAU USD Price Movement April 20 London Open: Gold Tests $4,800 Resistance
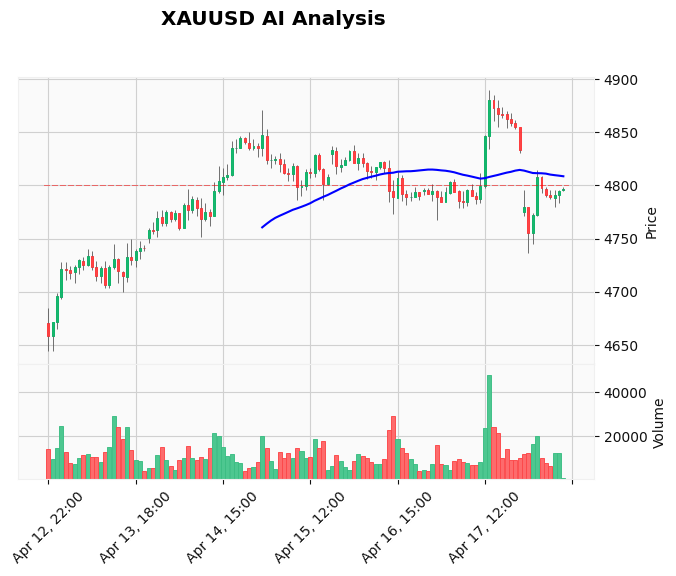
The XAU USD price movement on this April 20 London open presents a classic battle at a major psychological barrier. Gold is hovering just below the critical $4,800 level, having opened the European session at $4,795.37 and probing a high of $4,805.69. This technical resistance coincides with a significant fundamental cross-current: escalating US-Iran tensions provide a firm floor under prices, while anticipation of strong US Retail Sales data later this week is capping the upside. For traders, this creates a high-probability range-bound environment, where patience for a clearer breakout or a deeper pullback will be rewarded. If you're looking to trade this delicate balance without the emotional stress, our AI Trading Bot is designed to execute such range-bound strategies on XAU/USD with disciplined precision 24 hours a day.
Gold Market Overview: A Tense Equilibrium
The European session opens with Gold in a state of cautious equilibrium. The price is caught between a technical ceiling at $4,800 and the immediate support from the overnight Asian session low near $4,786.90. Market sentiment is decidedly neutral, as reflected in the webhook trend classification. The US Dollar is finding modest strength from rising Treasury yields, which traditionally pressures non-yielding assets like Gold. However, this pressure is being perfectly counterbalanced by a renewed safe-haven bid. News that Iran has once again moved to close the strategic Strait of Hormuz has reintroduced geopolitical risk premium into the market. This push-pull dynamic is likely to persist until the market gets clarity from tomorrow's high-impact US economic data, creating a tense but tradable range for the London session.
Technical Analysis: The $4,800 Wall
The technical picture for the XAU USD price movement is defined by clear, converging levels. The immediate hurdle is the cluster of resistance between $4,800 and the first major technical resistance at $4,838.31. Price is currently trading below both the 20-period EMA ($4,804.77) and the 50-period EMA ($4,807.21), indicating short-term bearish momentum. The 200-period EMA at $4,769.96 sits well below, acting as a major dynamic support. The RSI reading of 44.52 is in neutral territory, leaning slightly bearish but not yet oversold, suggesting room for a move in either direction. The MACD histogram is negative at -7.00 and below its signal line, confirming the near-term selling pressure. The Average True Range (ATR) of 21.74 points to moderate daily volatility. Key supports to watch are at $4,698.47 and $4,644.34. For now, the chart structure suggests a rejection at current levels is more probable than an immediate breakout, favoring a potential retest of support zones before the next significant move.
Fundamental Drivers: Geopolitics vs. Data
Two powerful fundamental forces are dictating the XAU USD price movement today. On the bullish side, the US-Iran geopolitical standoff has escalated sharply. Iran's actions in the Strait of Hormuz threaten global oil flows and regional stability, triggering a classic flight to safety into Gold. Concurrently, political uncertainty in Washington, with Senator Tillis blocking the nomination of Kevin Warsh as Fed Chair pending an investigation into Jerome Powell, adds a layer of institutional instability that Gold often thrives on. On the bearish side, the market is bracing for potentially robust US Retail Sales data due in just over 28 hours. Forecasts of 1.4% growth signal strong consumer demand, which could reinforce the "higher-for-longer" interest rate narrative and boost the USD. This creates a classic "sell the rumor" environment ahead of the data. Navigating this news-driven volatility is challenging, which is why many traders use tools like our News Trading Bot to automate entries around high-impact events.
Devil's Advocate: What Could Break the Stalemate?
While the bias is for range-bound consolidation, two clear scenarios could invalidate this view and trigger a directional move. First, a confirmed and sustained breakout above $4,820 (clearing the near-term EMA cluster and approaching R1) would signal that the bullish safe-haven bid has completely overwhelmed the pre-data USD strength. This would open a path toward the $4,871 resistance. Conversely, a breakdown below the Asian session low and the $4,770 level (200 EMA) would indicate that the market is positioning decisively for strong US data, prioritizing USD strength over geopolitical fears. This could trigger a swift move down toward the $4,700 support zone. The key for traders is to avoid committing to a strong directional bias until one of these levels gives way with conviction.
Trading Strategy for the European Session
Given the neutral technicals and conflicting fundamentals, the highest-probability strategy for the London session is to trade the range with a slight bearish tilt ahead of the US data. Look for a short entry on a rejection of the $4,800-$4,810 zone, targeting a move down toward the $4,770-4,780 support area. A conservative stop loss can be placed above $4,820. Alternatively, a buy opportunity emerges on a dip near the $4,770 level (200 EMA), targeting a bounce back to $4,795-4,800, with a stop below $4,760. Position sizing should be reduced to account for the impending high-impact event. This is a scalper's environment, perfect for strategies that capitalize on short-term mean reversion within a defined range. For traders who prefer a systematic approach to such conditions, our Price Action Pro EA specializes in identifying and trading these precise institutional order blocks and fair value gaps on the XAU/USD chart.
Risk Management: Navigating the Pre-Data Lull
Risk management is paramount when trading ahead of major data. The primary risk is a false breakout or breakdown that whipsaws positions before the real move begins. To mitigate this, keep positions smaller than usual—no more than 0.5-1% of your account risk per trade. The ATR of 21.74 suggests a reasonable stop-loss distance. Aim for a minimum 1:1.5 risk-reward ratio. If you enter a trade and price simply chops sideways without reaching your target, consider exiting at breakeven before the US data release to avoid unpredictable volatility. The goal today is not to hit a home run but to manage capital preservation and secure small, consistent gains from the range dynamics.
Frequently Asked Questions (FAQ)
Q: Why is the Gold price stuck around $4,800 today?
A: Gold is facing strong technical resistance at the $4,800 round number and the nearby 20 and 50-period EMAs. Fundamentally, it's caught between bullish geopolitical tensions (US-Iran) and bearish anticipation of strong US Retail Sales data tomorrow. This creates a temporary equilibrium, resulting in range-bound price action.
Q: Should I buy or sell Gold before the US Retail Sales data?
A> The prudent approach is to avoid taking a strong directional position. Instead, consider short-term range-trading strategies, like selling near resistance ($4,800-$4,810) or buying near support ($4,770-$4,780), with tight stops. Chasing a breakout in either direction before the data carries high risk of a false move.
Q: How significant is the Iran news for Gold prices?
A> Very significant. The Strait of Hormuz is a critical chokepoint for global oil shipments. Any threat to its stability triggers immediate safe-haven demand for Gold. This provides a solid underlying bid that prevents deep sell-offs, even when the US Dollar is strengthening on other factors.
Q: What happens if Gold breaks above $4,820?
A> A clean break and close above $4,820 would signal a victory for the bullish geopolitical narrative. It would negate the near-term bearish technical structure and likely trigger a momentum move toward the next key resistance at $4,838.31, with an eventual target of $4,871.31.
Conclusion
The London session for the XAU USD price movement on April 20 is defined by a tense standoff at $4,800. Traders are effectively marking time, weighing the immediate safe-haven demand from geopolitical fires against the looming threat of a hawkish USD repricing from strong retail data. The resulting range between $4,770 and $4,810 offers clear, tactical opportunities for those with the discipline to fade the extremes and manage risk tightly. The most important level to watch is the $4,770 support; a break there shifts the bias firmly bearish ahead of the data. For traders seeking to capitalize on these precise technical setups without constant screen time, our best-selling Gold trading bot executes a similar logic, scanning for high-probability reversal zones and managing the entire trade lifecycle from entry to exit.
Risk Disclaimer: Trading Gold (XAU/USD) involves significant risk of loss. This content is for informational purposes only and does not constitute financial advice. Always conduct your own research and trade responsibly.