XAU USD Price Movement April 16 London Open: Consolidation Above $4,800
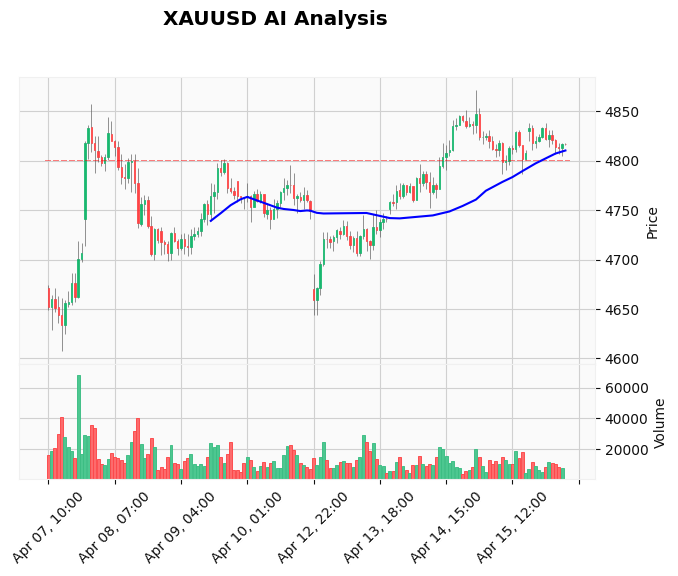
The XAU USD price movement on April 16 at the London open shows a market taking a tactical pause. After recent gains, gold is consolidating just above the $4,800 threshold, trading around $4,821 as European traders assess the landscape. The immediate focus is on whether bulls can muster the strength to challenge the $4,825-30 resistance zone or if profit-taking will trigger a pullback towards key support. With the primary trend still bullish, this consolidation is typical behavior following a strong push higher. Want to trade these nuanced Gold setups without the emotional stress? Our AI Trading Bot executes 24/7 on XAU/USD, systematically identifying entries and managing risk with an 83%+ win rate.
Gold Market Overview
The European session opens with XAU/USD in a state of equilibrium. The price is holding comfortably above the crucial 20-day EMA at $4,817 and the 50-day EMA at $4,804, which confirms the underlying technical strength. However, momentum has slowed from the Asian surge, creating a classic "wait and see" environment. Sentiment is being pulled in two directions. On one side, persistent geopolitical risks, particularly concerning the US-Iran dynamic, provide a solid floor for prices. On the other side, a slight improvement in global risk appetite, evidenced by record highs in major equity indices, is periodically draining safe-haven demand. This tug-of-war is keeping gold in a tight range, with traders reluctant to commit heavily before a clear directional catalyst emerges.
Technical Analysis
The technical picture for XAU/USD on April 16 is constructive but not overextended. The price is currently trading between the first key support at $4,801 and the immediate resistance at $4,825. The EMA structure is perfectly aligned for a bullish continuation: the price is above the 20 EMA ($4,817), which is above the 50 EMA ($4,804), which is well above the 200 EMA ($4,748). This stacked order indicates a strong underlying uptrend. The RSI reading of 52.95 is neutral, showing there is plenty of room for further upside before hitting overbought conditions. The MACD line at 4.83 remains above its signal line at 3.88, confirming positive momentum, although the histogram's size suggests the momentum surge may be slowing. The ATR of 16.31 points indicates moderate daily volatility, typical for consolidation phases. For traders, the key levels are clear: a sustained break above $4,825 opens the path toward $4,871, while a failure to hold $4,810 support could see a test of the stronger $4,698 zone.
Fundamental Drivers
The fundamental backdrop for gold is currently defined by competing narratives. The dominant supportive factor remains the geopolitical risk premium linked to tensions in the Middle East, specifically the US-Iran situation. Headlines regarding risks in the Strait of Hormuz continue to underpin gold, acting as a cap on any significant downside. However, the market's reaction to these risks is becoming more nuanced. There is a growing sense of cautious optimism, with traders seemingly in a "wait-and-see" mode rather than panic-buying. This is reflected in the price's inability to make a clean break higher despite the bullish technicals. The economic calendar is light for the USD today, removing a potential catalyst and leaving the market vulnerable to headline-driven swings. For traders looking to capitalize on these rapid news-driven moves, an automated News Trading Bot can scan headlines and execute trades in milliseconds, far faster than any human.
Devil's Advocate
While the trend is undeniably bullish, several factors could trigger a deeper correction. The primary risk is a sudden de-escalation of geopolitical tensions or a sustained shift towards "risk-on" sentiment in global markets. If equity markets continue their record run, the opportunity cost of holding non-yielding gold increases, which could prompt institutional profit-taking. Technically, the price is testing a logical profit-taking zone near $4,825, and the strong momentum on lower time frames suggests the move may be extended in the short term. The key level that would start to invalidate the immediate bullish bias for the European session is a sustained break below the $4,810 support. This level represents a consolidation low and the adjusted stop-loss area for existing managed trades. A close below here could see a swift move down to test the $4,801-4,798 support cluster.
Trading Strategy for This Session
Given the current setup—strong trend but extended price at resistance—the prudent strategy is one of patience. The AI Analysis Log's decision is "WAIT," and this is sound advice for discretionary traders as well. Chasing the market above $4,820 offers a poor risk-to-reward ratio. Instead, traders should look for one of two scenarios. First, a bullish breakout and daily close above $4,825 could be used as a confirmation signal for a continuation move towards $4,832 and then $4,850. A more favorable scenario would be a healthy pullback into the support zone between $4,815 and $4,810, where new long entries could be considered with a tight stop below $4,805. For those who prefer systematic trading, a Price Action Pro EA is designed to identify such pullback entries within a strong trend automatically, removing the guesswork.
Risk Management
Position sizing is critical when trading in a consolidation zone near key resistance. Risk should be kept to 1-2% of your account capital on any single Gold trade. If taking a long entry on a pullback to $4,815, a logical stop loss would be placed at $4,805, risking approximately $10 per ounce. The first take-profit target would be the recent high at $4,825, offering a 1:1 risk-reward. A final target could be set near $4,832 for a more ambitious 1:1.7 ratio. If the trade moves in your favor, consider moving your stop loss to breakeven once price reaches $4,822 to eliminate risk, as demonstrated in the AI's trade management. Always ensure your trades have a predefined risk-reward ratio of at least 1:1.5.
Frequently Asked Questions (FAQ)
Q: What is the key resistance level for XAU/USD on April 16?
A: The immediate and most critical resistance level is at $4,825. A confirmed break and close above this level would signal a continuation of the bullish momentum, potentially targeting $4,832 and then the more significant resistance at $4,871.
Q: Why is gold holding above $4,800 despite improved risk sentiment?
A: Gold remains supported by a persistent geopolitical risk premium, primarily related to US-Iran tensions. This acts as a structural floor, preventing deep sell-offs even when traditional safe-haven demand wanes due to rallies in stock markets.
Q: Is now a good time to buy gold?
A: For new long positions, the current price near $4,821 is not ideal due to its proximity to resistance. A better tactical entry would be to wait for a pullback towards the $4,815-4,810 support zone, which would offer a more favorable risk-reward setup.
Q: What is the short-term outlook for gold prices?
A: The short-term outlook is cautiously bullish but contingent on price action at $4,825. A failure to break higher could lead to a period of range-bound trading between $4,810 and $4,825. A successful breakout would reaffirm the uptrend.
Conclusion
The XAU USD price movement at the London open on April 16 reflects a market in a temporary balance. Bulls are defending the $4,810 support, fueled by a solid technical trend and geopolitical undercurrents, while bears are capping rallies at $4,825 amid intermittent risk-on flows. The resolution of this tight range will dictate the next leg. A break above $4,825 is the more likely outcome given the overarching bullish structure, but traders should avoid forcing entries. Patience for a confirmed signal or a better price is the professional approach. To implement such disciplined strategies around the clock, consider deploying our best-selling AI Trading Bot, which can monitor these key levels and execute managed trades 24 hours a day, even while you sleep.
Risk Disclaimer: Trading Gold (XAU/USD) involves significant risk of loss. This content is for informational purposes only and does not constitute financial advice. Always conduct your own research and trade responsibly.