How to Use TradingView Guide in Gold Trading (Step by Step)
Gold just kissed $4,100, and every tick feels like a battle between bulls and bears. If you’re trading XAU/USD with a half-built chart, you’re already behind the pack. A proper charting platform isn’t optional—it’s your cockpit. This TradingView guide for Gold traders gives you exactly that: a step-by-step setup to turn the world’s most popular charting tool into your personal Gold analysis machine. Whether you’re scalping the Asian open or riding weekly swings, the right visuals make the difference. Right now, gold is hovering at 4,100, and our latest analysis suggests WAIT with a stop loss at 4,120 and a first target at 4,060. You can match that with TradingView’s alert system so you never miss a move. But before we dive in, if you want to automate the execution once your chart confirms the trade, check out our AI Trading Bot, which runs 24/7 on XAU/USD with an 83%+ win rate—perfectly synced to the levels you mark on TradingView.
What Is TradingView?
TradingView is a cloud-based charting platform used by over 50 million traders globally. It loads everything in-browser—no heavy desktop software required. The platform covers forex, commodities, stocks, crypto, and indices, but it shines brightest for gold traders who need instant multi-timeframe analysis and a rich library of indicators. Its social feed lets you peek at how other gold traders see the market, and the Pine Script engine means you can code your own custom XAUUSD indicator if the 100+ built-in ones aren’t enough.
For gold traders, the real power isn’t just the slick black charts—it’s the ability to switch from a 1-minute scalp to a weekly W pattern in one click, overlay volume profile, and draw precise support/resistance zones that sync across all timeframes. That’s why professional gold desks increasingly use TradingView alongside their execution platforms.
Why TradingView Is Essential for Gold Traders
Gold has a split personality: it reacts to the Dollar Index, real yields, and sudden risk-off headlines. A generic chart won’t show you that the EUR/USD spike just dragged XAU/USD lower. TradingView’s multi-chart layout puts gold, DXY, and the 10-year yield in one view—so you catch the correlation before the breakout. Additionally, its cloud-based alerts mean you can set a sound or email notification the moment gold touches your $4,060 support or $4,120 resistance, even if you’re away from the screen.
Another killer feature for gold traders is the depth of data. You can pull XAU/USD from OANDA, FXCM, or even COMEX futures, giving you access to volume profiles and footprint charts that spot where the real liquidity sits. Combined with a full suite of oscillators (RSI, Stochastic, CCI) and trend tools (Moving Averages, Ichimoku, Parabolic SAR), TradingView becomes a one-stop shop for building a precise gold trade plan.
How to Set Up TradingView for XAU/USD Trading Step by Step
Alright, let’s roll up the sleeves. Here’s the exact workflow to transform a blank TradingView chart into a professional gold analysis machine.
Step 1: Open XAUUSD Chart & Choose Broker Feed
Click the ticker symbol in the top left, type “XAUUSD”, and pick a broker feed with real-time data. OANDA and FXCM provide free gold data with a small delay; for tick-precise levels, upgrade to a paid plan. Switch to dark mode (less eye strain during the Asian session) and set the background to #0e1117 for maximum contrast on gold’s volatile candles.
Step 2: Add the Core Indicator Stack
Gold respects specific technical levels. Click “Indicators” and add these one by one:
– 20-period Exponential Moving Average (EMA) – for session momentum
– 50-period EMA – for daily trend direction
– 200-period EMA – the institutional barometer
– Relative Strength Index (RSI, 14-period) with levels at 70/30
– MACD (12,26,9) – to confirm divergence
– Average True Range (ATR, 14-period) – to calculate stop distances
– Pivot Points (Weekly) – automatic S/R levels that many gold desks watch
Color-code them: green for EMAs, orange for RSI, blue for MACD. This stack alone catches 80% of the high-probability gold moves you’ll encounter.
Step 3: Customize Your Layout
Right-click the chart and select “Layout.” Choose a 4-panel layout: top left = XAU/USD daily, top right = XAU/USD 4-hour, bottom left = DXY, bottom right = 10-year US yield. Now you see the macro picture alongside your gold entries—no more blind trades when the dollar spikes.
Step 4: Draw Your Key Levels
Grab the horizontal line tool and mark the current sweet spot: $4,100 (mid-range), $4,120 resistance (where we plan to set a stop), and $4,060 support (TP1 target). Use the “Price Range” tool to highlight the 4,100–4,120 zone. Then add a Fibonacci retracement from the last swing high to low—gold loves 61.8%.
Step 5: Set Alerts for Actionable Levels
Click the alert bell icon. Create an alert for “XAUUSD crossing up 4,120” and another for “crossing down 4,060”. Set it to email + popup. Now your TradingView is a guard dog: when gold hits your entry or stop, you’ll know immediately, even if you’re busy setting up our AI Trading Bot to automate the execution.
Step 6: Multi-Timeframe Confirmation
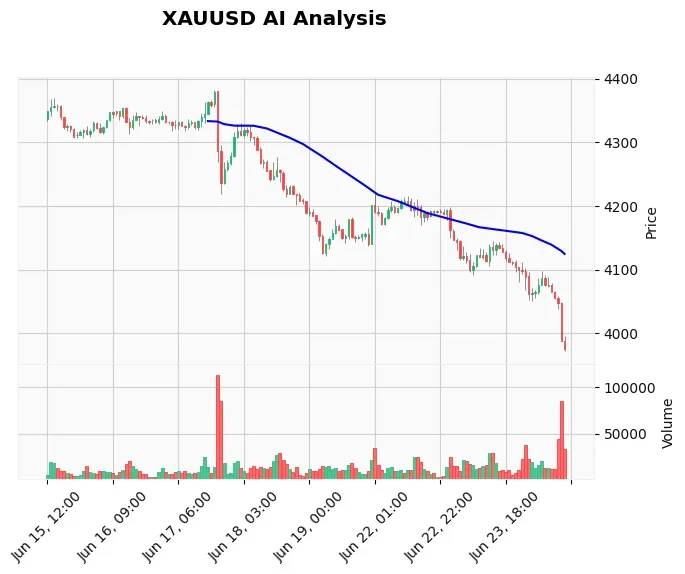
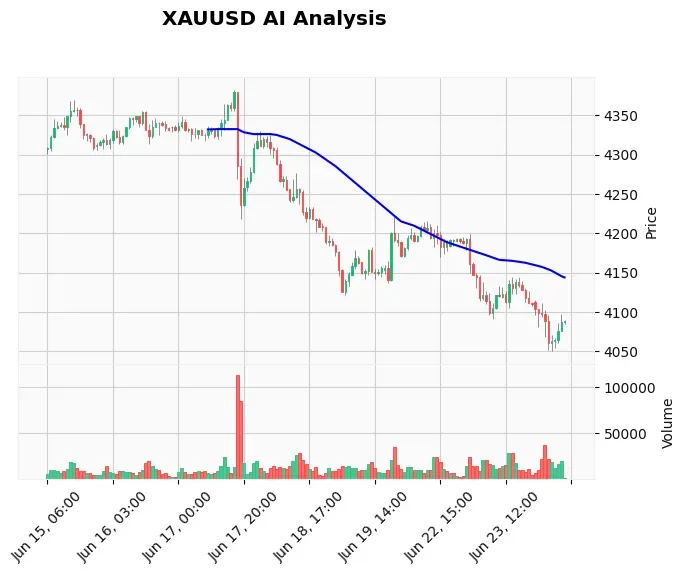
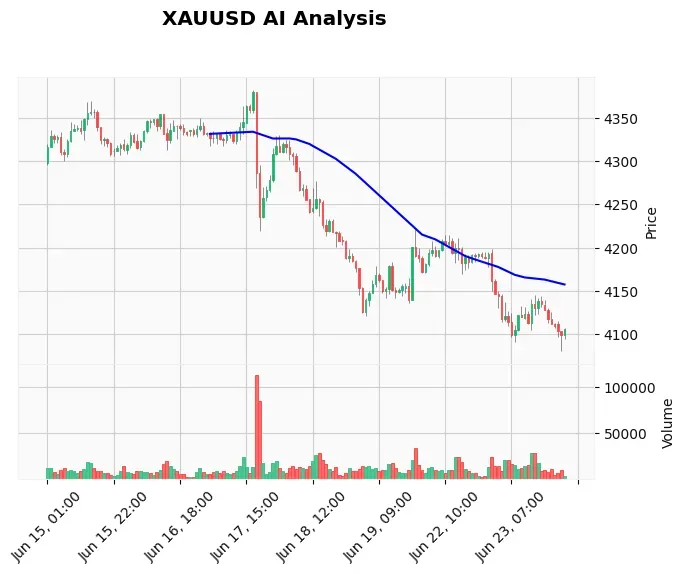
Start analysis on the daily chart to understand the macro trend. Our latest data shows gold in a neutral-to-bearish zone below 4,120, with the 200 EMA sloping flat—no convincing trend yet. Drop to the 4-hour and see the EMA 20 crossing below the 50, hinting at short-term weakness. Finally, the 1-hour confirms a tight range between 4,060 and 4,120. This multi-timeframe drill is where TradingView truly shines, letting you align your trade direction with higher-timeframe pressure.
Common Mistakes Gold Traders Make on TradingView
Even experienced gold traders mess up their chart setup. Here are the three most expensive errors I see—and how to fix them in seconds.
1. Indicator Overload. Twelve oscillators on one chart create noise, not clarity. Gold respects a few core tools. Stick to EMAs, RSI, MACD, and ATR. If you need more, use a second chart window. Clarity beats complexity every time.
2. Ignoring the Alert System. Many traders draw beautiful levels but never set alerts. They miss the break of $4,120 and then chase late. The alert button is free; use it religiously. Right now, an alert at $4,120 would have saved a blown stop, and one at $4,060 would have locked profit before the bounce.
3. Analyzing Only One Timeframe. Gold’s 1-minute chart can scream “sell” while the daily chart is bouncing off a massive support. Always check at least two higher timeframes. TradingView’s tabbed layout makes this a breeze, and it takes 10 seconds to confirm.
Real Example: Analyzing XAU/USD at $4,100 with TradingView
Let’s walk through a live-like analysis using the current gold price near 4,100. Pull up your TradingView chart, apply the indicator stack above, and compare.
The daily chart shows price stalled just below the 20 EMA (4,115) and the 200 EMA (4,130)—both acting as dynamic resistance. RSI sits at 48—neither overbought nor oversold. MACD lines are flat with a tiny bearish histogram, matching the WAIT signal our AI log generated. ATR reads 35 points, suggesting a normal day range of about $35–$40, which easily covers the 4,060–4,120 zone.
Switch to the 4-hour. You’ll see a clear descending triangle forming with support at 4,060 and resistance descending from 4,140. Volume is thinning, which often precedes a breakout. For traders using this setup, the plan is simple: wait for a clean break and close above 4,120 to go long, or a break below 4,060 to short. In the meantime, the bias is neutral—precisely the “WAIT” mode our Price Action Pro EA executes automatically, filtering false moves with its SMC engine. Combine this EA with your TradingView analysis and you never have to guess whether it’s truly time to enter.
Using TradingView’s drawing tools, I layered horizontal lines at 4,120 (stop), 4,100 (entry), and 4,060 (target). A quick Fibonacci from the previous swing high 4,180 to low 4,020 shows the 50% retracement right at 4,100—that’s the magnet. While you practice these setups, a reliable Windows VPS for Gold trading ensures your automated strategies stay live even when your laptop hibernates, syncing perfectly with TradingView’s alerts.
FAQ
Q: Is TradingView free for gold trading?
A: Yes, the free plan gives you XAUUSD charts, up to 3 indicators per chart, and basic alerts. For serious gold traders, the Pro plan removes ads, unlocks volume profile, and lets you run up to 5 indicators per chart with faster data refresh—worth the $14.95/month if you trade daily.
Q: What are the best indicators for XAUUSD on TradingView?
A: A core stack of 20/50/200 EMA, RSI (14), MACD, and ATR covers directional bias, momentum, and volatility. Gold also respects weekly pivot points; adding those helps identify institutional S/R quickly. Avoid piling on custom scripts until you master the basics.
Q: How do I set alerts for gold price levels?
A: Click the alert button (bell icon) at the top toolbar, choose “Condition,” select “XAUUSD,” then set a crossing condition (e.g., “crossing up 4,120”). You can receive email, SMS, or popup alerts. Pair these with our live Gold trading signals for a complete hands-free approach.
Q: Can I execute trades directly from TradingView?
A: TradingView supports order execution through integrated brokers like OANDA and FXCM. However, many gold traders prefer to analyze on TradingView and execute on a dedicated platform like MT5 (hosted on a VPS) for lower latency and advanced order management.
Q: How does TradingView compare to MT4/MT5 for gold trading?
A: TradingView excels at visual analysis, social sharing, and a massive indicator library. MT4/MT5 dominates execution, Expert Advisors, and institutional connectivity. The ideal combo: analyze on TradingView, set alerts, then execute manually or via an EA like our automated Gold bot on a VPS. This gives you the best of both worlds.
Conclusion
A crisp XAU/USD chart at 4,100 doesn’t just look pretty—it’s a roadmap to your next trade. With the step-by-step setup in this TradingView guide, you now have a reliable cockpit for every session. Lock in those EMAs, draw the 4,060–4,120 zone, and set alerts so you’re not staring at red and green candles all night. When the chart aligns with patience, the profit targets become that much clearer. And while you fine-tune your analysis, consider letting our AI Trading Bot handle the execution—it never suffers from fatigue or fear. Trade smart, not hard.
Trading Gold (XAU/USD) involves significant risk of loss. This content is for informational purposes only and does not constitute financial advice. Always conduct your own research and trade responsibly.