The 2026 Macroeconomic Re-Alignment: Federal Reserve Policy Traps, Geopolitical Ceasefire Dynamics, and the Structural Evolution of Global Credit Markets
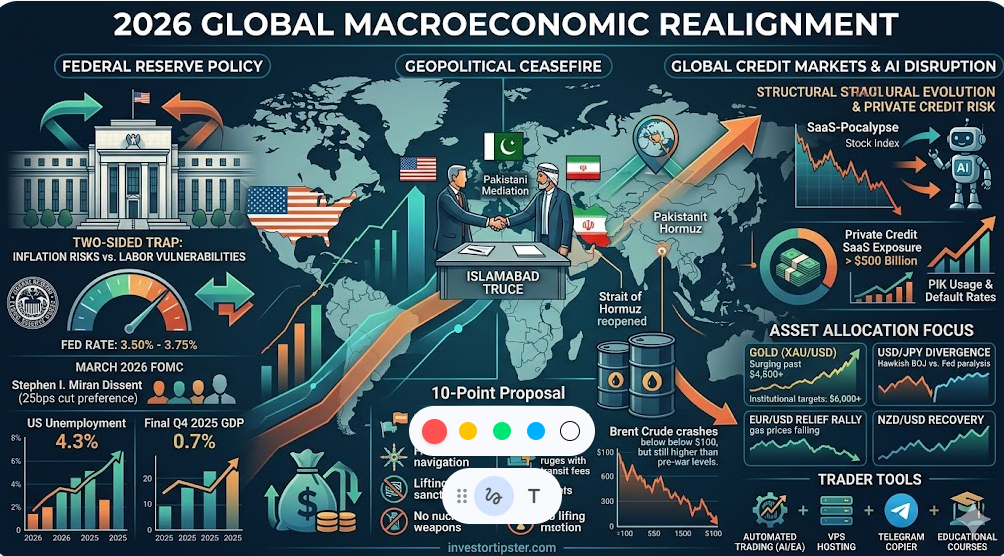
The global financial landscape in the second quarter of 2026 has entered a phase of profound structural re-alignment, driven by the convergence of hawkish central bank signals, a dramatic geopolitical pivot in the Middle East, and the emerging fragility of the private credit ecosystem. The release of the March 17-18, 2026, Federal Open Market Committee (FOMC) minutes, coupled with the April 8, 2026, announcement of a two-week conditional ceasefire between the United States and Iran, has created a "volatility reset" that demands a sophisticated, multi-asset class approach to risk management and capital allocation. For professional traders and institutional investors, the current environment is no longer defined by simple "risk-on" or "risk-off" binaries; instead, it is characterized by a "two-sided trap" where persistent inflation risks collide with labor market vulnerabilities and technological disruption in the credit markets.
The Federal Reserve’s Strategic Paralysis: A Deep Analysis of the March 2026 FOMC Minutes
The minutes from the March 17-18 meeting reveal a Federal Reserve that is deeply unsettled by the "cumulative supply-stack shock" currently affecting the U.S. economy. While the Committee voted to maintain the federal funds rate at 3.50% to 3.75%, the internal discourse shifted significantly toward a more hawkish posture than previously communicated in January. The "vast majority" of participants identified upside risks to inflation and downside risks to employment as elevated, leading to a state of policy paralysis where the Fed feels "once burned, twice cautious" regarding premature easing.
The Dissent of Stephen I. Miran and the Internal Hawkish Escalation
A critical development in this meeting was the formal dissent by Governor Stephen I. Miran, who preferred a 25-basis-point rate cut. Miran’s dissent highlights a growing friction within the Board of Governors between those focused on forward-looking productivity gains from artificial intelligence (AI) and those wedded to lagging, data-dependent inflation metrics. Despite this lone dovish voice, the broader headline of the minutes was the escalation of the "hike discussion." "Some participants" argued for the introduction of a "two-sided description" of future rate decisions, effectively signaling that rate increases could become appropriate if inflation remains stubbornly above the 2% target.
This shift from "roughly balanced" risks in January to an active debate over rate hikes in March indicates that the Fed is increasingly uncomfortable with the "higher-for-longer" narrative being the only alternative to cuts. The market has largely synchronized with this skepticism, pricing only a 40% chance of a single cut by December 2026. For those looking to master the intricacies of these central bank shifts, our(https://investortipster.com/courses/courses/) provide the fundamental framework necessary to interpret these high-level policy transitions.
Labor Market Vulnerabilities and the Healthcare Concentration Risk
The Committee’s assessment of the labor market has become notably blunt. Participants warned that in a "low-hiring environment," even a minor drop in labor demand could push the unemployment rate "sharply higher". A major point of concern is the concentration of job gains in a few non-cyclical sectors like healthcare, which the Fed views as a potential warning sign of underlying economic fragility rather than a source of broad-based strength.
| Economic Indicator | March 2026 Reading | Market Expectation | Significance |
|---|---|---|---|
| Nonfarm Payrolls (Mar) | 178,000 | 65,000 | Rebound from Feb contraction |
| Unemployment Rate | 4.3% | 4.4% | Marginal improvement but stable |
| ISM Services (Employment) | Contraction | Expansion | Signals underlying demand weakness |
| Real GDP Q4 2025 (Final) | 0.7% | 1.4% (Advance) | Significant downward revision |
The downward revision of Q4 2025 GDP from 1.4% to 0.7% suggests that the U.S. economy entered 2026 with much less momentum than previously thought. This "deceleration" was primarily driven by downturns in government spending and exports, alongside a softening of consumer spending. For automated traders, navigating this landscape of contradictory data requires high-precision execution. Our(https://investortipster.com/marketplace/product/ai-trading/) is optimized to filter through these complex fundamental signals, identifying the highest-probability setups in both Gold and Forex markets.
The Geopolitical Architecture of the Islamabad Truce: A Two-Week Volatility Reset
On April 8, 2026, a dramatic shift in the Middle East conflict occurred when the United States and Iran agreed to a two-week conditional ceasefire, brokered through intensive mediation by Pakistani Prime Minister Shehbaz Sharif. This truce, which President Trump described as being based on a "workable" 10-point proposal from Tehran, has temporarily suspended the bombing campaigns that had driven Brent crude oil prices above $119 per barrel in March.
Deconstructing Iran’s 10-Point Proposal
The proposal currently serving as the basis for negotiations in Islamabad represents a significant potential overhaul of the regional order. The core demands and concessions involve a complex exchange of security guarantees for economic relief.
| Point # | Iranian Demand / Condition | Strategic Implication |
|---|---|---|
| 1 | Complete cessation of war on Iraq, Lebanon, Yemen | Regional de-escalation of proxy fronts |
| 2 | Permanent cessation of attacks on Iran | End to direct US/Israeli strikes |
| 3 | Reopening of the Strait of Hormuz | Restoration of 20% of global oil supply |
| 4 | Protocol for freedom and security of navigation | Introduction of transit fees ($1-2M per tanker) |
| 5 | Withdrawal of U.S. combat forces from the region | Potential "capitulation" or regional realignment |
| 6 | Full payment of reconstruction costs | Economic reparations for infrastructure damage |
| 7 | Full commitment to lifting all sanctions | Re-entry of Iranian crude into legal markets |
| 8 | Release of all frozen Iranian assets | Massive liquidity injection for Tehran |
| 9 | Commitment to not seeking nuclear weapons | "No enrichment" and removal of "nuclear dust" |
| 10 | Immediate ceasefire across all fronts | Stabilization of the "supply-stack shock" |
While the ceasefire has provided a massive relief rally for equities and a plunge in oil prices, the "road to normalization is long". Israel has already indicated that the ceasefire does not apply to its operations in Lebanon against Hezbollah, and localized air attacks continue to be reported, highlighting the fragility of the truce. Professional traders should utilize our(https://investortipster.com/marketplace/product/news-trading/) to capitalize on the rapid price gaps that occur when headlines regarding the "Islamabad talks" hit the tape.
Energy Markets and the "Ceasefire Crash"
The immediate reaction to the ceasefire was a "crash" in oil prices, with Brent and WTI falling between 13% and 18% in a single session. This drop below $100 per barrel is the market’s way of pricing in the "probability of resumption" of oil flows through the Strait of Hormuz. However, manufacturing scars run deep. The disruption to Middle Eastern refining capacity and the total halt of major aluminium smelters like EGA Al Taweelah means that even if the ceasefire holds, supply chains for industrial metals and petrochemicals will take 3 to 6 months to recover.
Automotive giants like Toyota and Nissan have already cut production by tens of thousands of units due to maritime backlogs in the Gulf. For the global economy, the critical reference point remains the $72.87 price of Brent on February 27; even after the ceasefire rally, energy prices remain 25% higher than pre-war levels, keeping energy budgets under material pressure. To manage the volatility in oil-correlated pairs and commodities, we recommend our(https://investortipster.com/signals/) for real-time entries that account for these geopolitical shifts.
Gold (XAU/USD) Deep Dive: Structural Bullishness vs. Tactical Treachery
Gold has remained the "defining asset" of 2026, caught between its role as a geopolitical hedge and its sensitivity to the "higher-for-longer" interest rate environment. Since the start of the Iran conflict on February 28, bullion has seen a peak-to-trough decline of 25%, driven by a "violent liquidity event" in March where investors were forced to sell gold to meet margin calls in energy and equity derivatives.
Technical Analysis: Reclaiming the Bullish Trend
As of April 8, 2026, Gold has staged a significant recovery, surging 4% to reclaim the $4,800 level and its 50-day Simple Moving Average (SMA). The current price action is testing a "pivotal resistance zone" between $4,850 and $4,910, which aligns with the 200-day SMA and the 61.8% Fibonacci retracement of the March decline.
| Support/Resistance Type | Price Level | Technical Significance |
|---|---|---|
| Major Resistance | $5,250 | Target for sustained breakout |
| Critical Resistance | $5,025 | 61.8% Retracement of record high decline |
| Intermediate Resistance | $4,930 | 50-day SMA cluster |
| Pivot Level | $4,855 | 100% extension of recent advance |
| Immediate Support | $4,738 | 21-day SMA |
| Structural Floor | $4,668 | 100-day SMA |
| Bearish Target | $4,180 | 200-day SMA (Long-term) |
The RSI has moved above 60, confirming strong bullish intent without being overbought, while the ascending trendline from recent lows remains intact, supporting a "higher lows" pattern. For those trading Smart Money Concepts (SMC), our Price Action Pro EA is the ideal tool for identifying the "order blocks" and "liquidity sweeps" that occur around these critical SMA clusters.
The Institutional Case for $6,000 Gold
Despite short-term volatility, the structural case for Gold is the strongest it has been in decades. Central banks in emerging markets, led by China and India, are purchasing an estimated 60 tonnes of gold per month in 2026 as part of a permanent "de-dollarization" trend. Major investment banks have revised their year-end targets upward to reflect this shift:
- Goldman Sachs: $5,400 per ounce (Reaffirmed).
- Deutsche Bank: $6,000 per ounce (Reiterated).
- UBS: $6,200 per ounce (Upside scenario of $7,200).
- JP Morgan: $6,300 per ounce (2026 target).
The "inflation conundrum" remains a double-edged sword for gold. If the ceasefire leads to a faster cooling of headline inflation, it may allow the Fed to resume rate cuts, which would eliminate the "carry cost" headwind for gold and facilitate a push toward the $5,600 all-time highs. We strongly recommend our(https://investortipster.com/marketplace/product/ai-trading/) as the top choice for Gold traders, as it combines technical indicators with fundamental scraping to navigate these extreme price swings with an 83%+ win rate.
Private Credit and the "SaaS-pocalypse": The $500 Billion AI Disruption Risk
A significant "buried nugget" in the March FOMC minutes and recent BIS reports is the rising strain in private credit markets, specifically lending to the Software-as-a-Service (SaaS) sector. Lending by private credit funds to SaaS firms has exploded from $8 billion in 2015 to over $500 billion by the end of 2025, now representing 19% of total direct loans.
The AI Disruption Mechanism
The market narrative has shifted from seeing AI as a tailwind to recognizing it as a "significant disruptor" for established software business models. The marginal cost of producing software is moving toward zero, which threatens the "near-perfect retention rates" and high multiples that private equity firms paid between 2018 and 2022. Between October 2025 and February 2026, software stocks collapsed by 30%, while Business Development Companies (BDCs) with high SaaS exposure have underperformed their peers by 5 percentage points.
| Private Credit Metric | Current Status (Q1 2026) | Market Implication |
|---|---|---|
| SaaS Loan Concentration | 19% of all direct loans | High sectoral concentration risk |
| PIK Usage | 8% of BDC investment income | Borrowers struggling with interest burdens |
| "True" Default Rate | ~5% (including selective defaults) | Higher than the 2% headline rate |
| Redemption Requests | "Notable increases" | Liquidity pressure on evergreen funds |
As John Zito of Apollo Asset Management noted, the software sector is currently in a cycle similar to the 2007 iPhone launch; revenues may appear stable today, but the "structural risks" could take years to fully manifest as AI displaces legacy codebases. For individual investors, this means checking the "quarterly reports" of BDC holdings for software-sector exposure is a mandatory risk-management step. To run automated strategies that can exit positions 24/7 during these "liquidity events," a high-speed(https://investortipster.com/vps/) is essential for maintaining constant connectivity to the markets.
Global Forex Trends: Interest Rate Divergence in the Post-Ceasefire Era
The US Dollar Index (DXY) has come under broad pressure following the ceasefire, trading around 98.85 as markets "fade" the inflation-driven hawkishness of the Fed. This has created a unique opportunity for currency traders to play the "normalization" of global interest rate spreads.
The Bank of Japan (BOJ) Normalization
For the first time since 1995, we are seeing significant hawkish movement from Japan. The short-term policy rate has reached 0.75%, and there is a 70.4% chance of another hike in April, potentially bringing rates to 1.25% by year-end. This "divergence" is putting downward pressure on USD/JPY, making it a favorite for carry-trade unwinding.
The RBNZ and the "Kiwi" Recovery
The Reserve Bank of New Zealand (RBNZ) has maintained the Official Cash Rate (OCR) at 2.25%, but the conversation has shifted toward potential hikes to 2.50% by later this year. The NZD/USD pair has seen an RSI rebound to 69.37, approaching the overbought threshold as "ceasefire relief" meets a hawkish shift in domestic policy.
EUR/USD and the Energy Relief Rally
The Euro has surged back below 1.1700 as European gas prices slid 20% on news of the ceasefire. The reduction in the "energy tax" on the Eurozone economy has improved the 2026 growth outlook for the region, even as inflation risks remain sticky. Traders who follow master accounts should use our(https://investortipster.com/cloud-copy-trading/) service to replicate these high-alpha Forex moves without the need for manual monitoring.
Strategic Implementation for the Modern Trader: Tools and Methodology
Navigating the "polycrisis" of 2026—characterized by war, technological disruption, and central bank uncertainty—requires a disciplined suite of automated tools.
1. Automation and High-Frequency Execution
In a market where a single Truth Social post can trigger a 15% move in crude oil, manual trading is no longer sufficient. Our(https://investortipster.com/ea-robots/) are designed to execute trades based on pre-defined logic, ensuring that you capture price movements even when you are away from your desk. These systems must be hosted on a(https://investortipster.com/vps/) to ensure 100% uptime and low-latency execution during high-impact news releases.
2. Following the "Smart Money"
The proliferation of signal channels on Telegram has made it easier to follow institutional-grade analysis. To bridge the gap between analysis and execution, our(https://investortipster.com/marketplace/product/telegram-copier/) automatically translates signals into MT4/MT5 trades. This is particularly effective when used in conjunction with our(https://investortipster.com/tools/), which provide the technical confirmation needed to vet external signals.
3. Education and Long-term Mastery
The most successful traders in 2026 are those who understand the "mechanism" of the market—from the way "transit fees" impact oil prices to the "NAV discount" in BDCs. We encourage all our clients to engage with our(https://investortipster.com/courses/courses/) to build a professional-level understanding of market macro-dynamics.
The Path Forward: Final Insights and Actionable Strategies
The ceasefire between the United States and Iran is a "fragile truce," not a permanent peace. While it has provided a window of relief for global markets, the underlying structural issues—elevated government debt, the "low-hiring" trap at the Fed, and the AI-driven disruption of the software sector—remain unresolved.
For the remainder of Q2 2026, the priority for traders should be:
- Gold Accumulation: Look for entries near the 21-day SMA ($4,738) and 100-day SMA ($4,668) to play the long-term move to $6,000.
- Currency Rebalancing: Target "divergent" pairs like NZD/USD and USD/JPY where central bank policy is shifting away from the Fed's "higher-for-longer" stance.
- Credit Monitoring: Avoid over-exposure to SaaS-heavy BDCs and private credit funds as redemption pressures and AI-disruption headlines intensify.
By leveraging the expert-level insights and best-selling automated tools from investortipster.com, you can transform this period of extreme volatility into a period of unprecedented profitability.
Check out our best-selling AI Bot here to automate your Gold trading with an 83%+ win rate, or Master the markets with our courses to stay ahead of the next major macroeconomic shift. For those focused on technical precision, Highlight the Price Action Pro EA as your primary tool for navigating the Smart Money Concept levels discussed in this report. Stay connected, stay informed, and trade with confidence.