How to Use Ichimoku Cloud in Gold Trading: XAUUSD Guide
If you've ever watched Gold price whip around and felt lost, the Ichimoku Cloud can change that. This all-in-one indicator gives you trend, momentum, and support/resistance with a single glance. With XAUUSD hovering near $4,028, understanding how to read those five lines can mean the difference between catching a swing and missing the move completely. While no indicator is magic, Ichimoku’s structure helps you trade Gold with the calm patience of a veteran. Want to put this system to work without staring at screens all day? Our AI Trading Bot automatically executes Ichimoku-based setups on XAUUSD with proven consistency.
What Is the Ichimoku Cloud?
Ichimoku Kinko Hyo, or 'one glance equilibrium chart,' is a technical indicator developed by Japanese journalist Goichi Hosoda in the 1930s. It consists of five lines that together paint a complete picture of the market at a glance. The Tenkan-sen (turning line) is the average of the highest high and lowest low over the last nine periods—a fast signal line. The Kijun-sen (standard line) does the same over 26 periods, acting as a slower trend confirmator. Senkou Span A and B form the 'cloud' (kumo) projected 26 periods into the future; Span A is the average of the Tenkan and Kijun, while Span B is the midpoint of the last 52 periods. Finally, the Chikou Span (lagging line) plots today’s closing price shifted 26 periods back. When all five lines are in harmony, Ichimoku delivers high-probability signals—especially on Gold, where trends can be violent and reversals sudden.
Why It Matters for Gold Traders
Gold is notorious for sudden spikes and protracted trends, often triggered by news events or shifts in Fed policy. The Ichimoku Cloud excels in this environment because it adapts dynamically to volatility. The cloud itself acts as a forward-looking support/resistance zone: if price is above a bullish (green) cloud, dips are buyable; below a bearish (red) cloud, rallies are likely selling opportunities. For XAUUSD, where a $50 move can materialize in minutes during high-impact news, the cloud’s shifting structure keeps you on the right side without constantly redrawing trendlines. Moreover, the Tenkan/Kijun cross—a classic entry signal—works well on the 4-hour and daily charts, giving you the patience to wait for confirmation instead of chasing every tick. For automated news trading, you can also pair Ichimoku with a dedicated high-impact news trading bot that reacts to events while you sleep.
How to Use It Step by Step
1. Add the indicator in MT4 or MT5. Open a Gold chart (preferably daily or 4-hour), click Insert → Indicators → Trend → Ichimoku Kinko Hyo. Keep the standard settings: 9, 26, 52. The default color scheme is fine, but you can highlight the cloud edges for clarity.
2. Assess the overall trend with the cloud. Ask one question: is price above or below the future cloud? Above suggests bullish trend; below, bearish. If price is inside the cloud, the trend is neutral—avoid trading or wait for a breakout.
3. Look for a Tenkan/Kijun cross. A bullish signal occurs when the Tenkan (fast line) crosses above the Kijun (slow line) while price is above the cloud. A bearish signal is the opposite: Tenkan crosses below Kijun with price below the cloud. This cross gives you the exact entry zone.
4. Confirm with the Chikou Span. The lagging line must be in clear space relative to price 26 bars ago—above for buys, below for sells. This avoids head fakes.
5. Set your stop-loss and take-profit using Ichimoku levels. For a long trade, place your stop a few pips below the Kijun-sen or the cloud’s upper edge. For a short, stop above Kijun or cloud. Take-profit can target the far side of the cloud or previous swing highs/lows. Because Gold’s moves are large, consider using the ATR for a trailing stop. Once you master these steps, running them automatically on a low-latency trading VPS keeps the strategy running 24/5 without interruption.
Common Mistakes Gold Traders Make
Ignoring the cloud’s forward projection. Many traders forget that Senkou Span A and B are shifted forward. The cloud isn’t just current support/resistance; it tells you where potential future support/resistance will be. Trading against a thick future cloud is risky.
Relying only on the Tenkan/Kijun cross. A cross inside a flat cloud means nothing. Always require the cross to happen outside the cloud (or near its edge with a breakout) for a valid signal.
Using too short a timeframe. On 5-minute or 15-minute Gold charts, Ichimoku generates false crosses constantly. Stick to H4, D1, or at minimum H1 after confirming a higher-timeframe alignment.
Forgetting the Chikou Span confirmation. Without Chikou checks, you’ll enter trades right as momentum fades. If the lagging line is tangled with past candles, step aside.
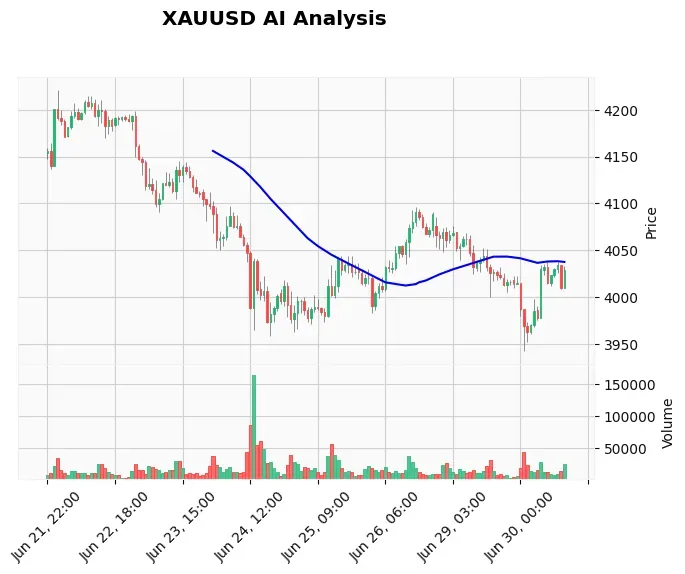
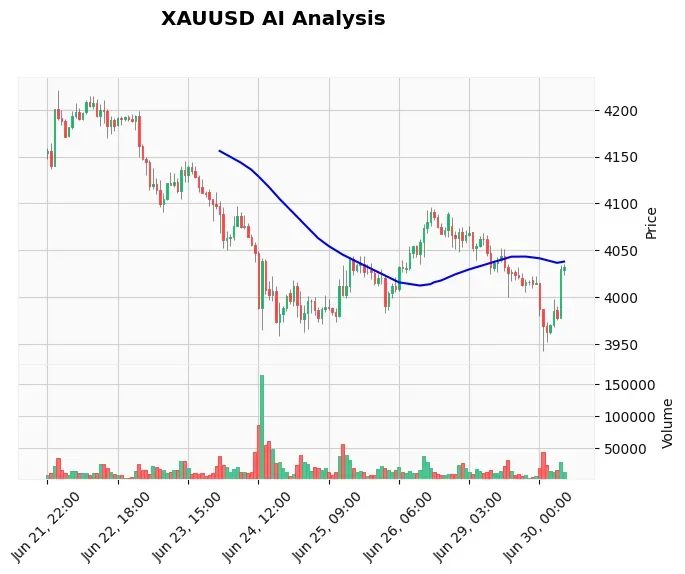
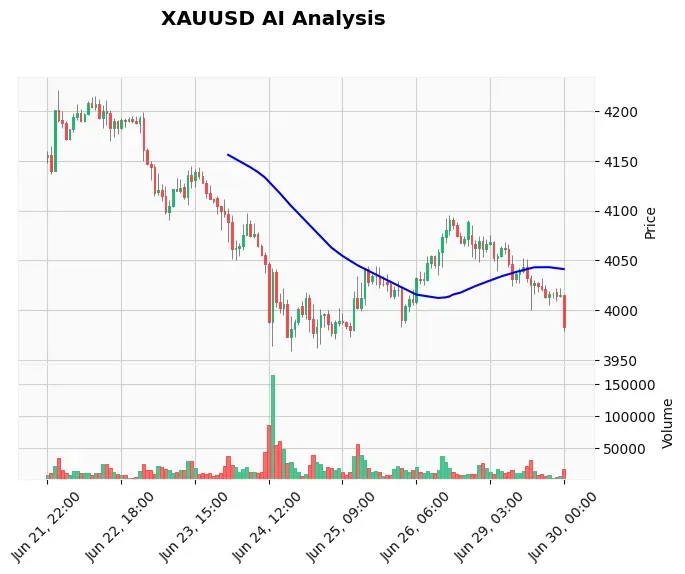
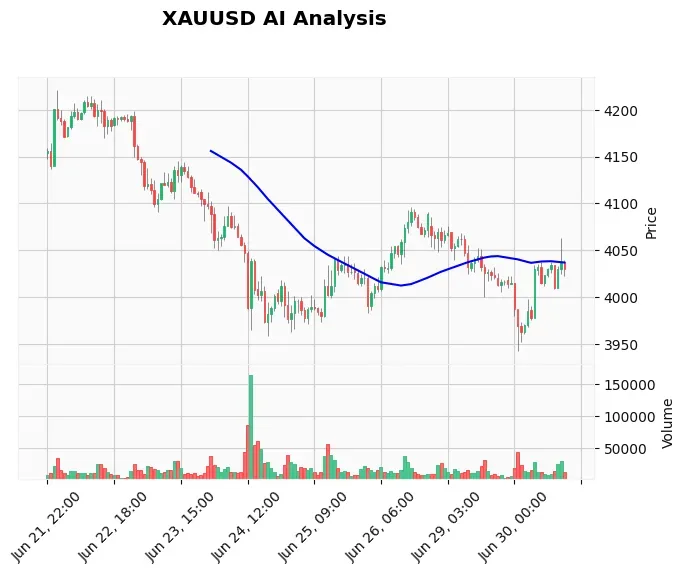
Real Example on XAUUSD Chart
Let’s apply Ichimoku to the current market. As of June 29, XAUUSD trades near $4,028 on the daily chart. The Tenkan-sen sits at $4,050, the Kijun-sen at $4,100, and the cloud is red (bearish) with Senkou Span A at $3,950 and Span B at $4,200. Price has broken below both Tenkan and Kijun and is now resting inside the cloud—a classic bearish continuation setup. The Chikou Span is below the price action of 26 days ago, confirming downward momentum. A short entry near the breakdown of $4,028 with a stop above the Kijun ($4,100) offers a risk-reward toward the bottom of the cloud at $3,950. If the cloud holds as resistance on the top side, the downtrend could accelerate. For traders who prefer automated execution of such pre-defined setups, our Price Action Pro EA can monitor these levels and execute with no emotion.
Frequently Asked Questions
Q: What timeframes work best for Ichimoku on Gold?
A: The daily and 4-hour charts provide the most reliable signals because they filter out intraday noise. Hourly is acceptable only when the daily cloud direction aligns and price is approaching a cloud edge.
Q: Can Ichimoku be used as a standalone strategy for XAUUSD?
A: Yes, many professional traders use it in isolation. However, combining it with basic support/resistance or the ATR for stop placement improves the win rate and sharpens risk management.
Q: How do you handle false breakouts when the cloud is thin?
A: Thin clouds act as weak support/resistance. Wait for a full candle close outside the cloud and a Tenkan/Kijun cross in the direction of the break before entering. A thin cloud failing to hold price often leads to a sharp expansion.
Q: Is the Ichimoku Cloud suitable for a beginner Gold trader?
A: It has a steeper learning curve than a simple moving average, but the clarity it brings makes it an excellent long-term tool. Start with the daily chart, focus only on price relative to cloud and the Kijun flat for trend, and gradually add the other lines.
Q: Can I combine Ichimoku with Gold-specific fundamentals?
A: Absolutely. Use Ichimoku for tactical entries, and let the macro picture (DXY, real yields, Fed speak) determine the fundamental bias. On days like FOMC, a news trading bot can handle the noise while your Ichimoku framework keeps you positioned correctly.
Conclusion
Ichimoku transforms the chaos of Gold trading into a structured, repeatable process. By reading the cloud, the cross, and the lagging line together, you gain an edge that eliminates guesswork. The key takeaway today: monitor whether XAUUSD rejects the top of the daily cloud near $4,200 or pierces the bottom at $3,950—that break will define the next swing. Practice these concepts on a demo account until they become second nature, and when you’re ready to automate, our AI Trading Bot can trade the Ichimoku rules on Gold around the clock with discipline and speed.
Risk Disclaimer
Trading Gold (XAU/USD) involves significant risk of loss. This content is for informational purposes only and does not constitute financial advice. Always conduct your own research and trade responsibly.