How to Use RSI in Gold Trading: A Complete Guide for XAUUSD Traders
If you’ve ever hesitated at a Gold chart, unsure whether to jump on a breakout or wait for a pullback, the Relative Strength Index (RSI) can give you the clarity you need. RSI is one of the most widely used momentum oscillators, but many traders misuse it—especially on volatile instruments like XAU/USD. Today, with Gold hovering around the $4,030 level, we have a textbook setup that shows exactly how to apply RSI with precision. To enhance your RSI analysis further, our Gold technical analysis tools provide custom indicator configurations and real‑time alerts that filter out false signals.
What Is the Relative Strength Index (RSI)?
RSI was developed by J. Welles Wilder and measures the speed and change of price movements. The indicator oscillates between 0 and 100, with a standard 14‑period setting. Readings above 70 traditionally signal overbought conditions, while readings below 30 indicate oversold territory. It’s a leading indicator, meaning it often shifts before price does, giving traders early warnings of potential exhaustion. Because Gold often trends strongly and then consolidates sharply, RSI helps you gauge when momentum is genuinely fading rather than just cooling off in a healthy trend.
Why It Matters for Gold Traders
Gold’s safe‑haven nature means it can move on fear, inflation data, or central‑bank headlines—and that volatility can create false overbought/oversold readings if you aren’t careful. In a strong uptrend, RSI may remain above 70 for days; in a downtrend, it can cling below 30 without reversing. The real value of RSI for XAUUSD traders lies in combining it with support, resistance, and divergence to catch high‑probability turning points. When Gold is consolidating near a key level—like the $4,030 handle right now—RSI divergence becomes a powerful confirmation tool.
How to Use RSI Step by Step on XAUUSD
Step 1: Setting Up RSI on Your Platform
In MT4 or MT5, go to Insert > Indicators > Oscillators > Relative Strength Index. Keep the default 14 periods and apply it to the close. For Gold’s higher volatility, some traders adjust overbought/oversold thresholds to 80/20 to reduce noise on shorter timeframes. Test different settings on a demo account first.
Step 2: Identifying Overbought and Oversold Signals
In a range‑bound market, an RSI dip below 30 followed by a cross back above 30 can be a buy signal; a rise above 70 followed by a fall below 70 can be a sell signal. But never trade these in isolation—always check the prevailing trend. In a strong bull trend, look for RSI pullbacks to the 40–50 zone as potential entry points.
Step 3: Trading with the Trend
If Gold is clearly trending higher, RSI will typically oscillate between 40 and 80. Instead of waiting for a drop to 30, you wait for a retracement to 45–50 within the trend. Conversely, in a downtrend, RSI rarely reaches 70; short entries are better when RSI rallies to 50–60 and then turns lower.
Step 4: Spotting Divergence
Divergence is where price and RSI disagree. A bearish divergence occurs when price makes a higher high but RSI makes a lower high—signaling that momentum is failing. A bullish divergence appears when price makes a lower low but RSI makes a higher low. On Gold’s H4 chart today, near $4,030, we can see early signs of bearish divergence, which we’ll examine in detail shortly.
Step 5: Combining RSI with Support & Resistance
The best trades occur when RSI divergence aligns with a key level. At $4,030, a support zone, a bearish RSI divergence would warn that a breakdown is likely—giving you a clear short setup. For a structured approach to combining RSI with price action and institutional levels, many traders turn to our learn to trade XAUUSD courses that walk through these exact scenarios from entry to exit.
Common Mistakes Gold Traders Make with RSI
Mistake 1: Blindly selling when RSI crosses below 70 in a raging bull market. Gold can stay overbought for days while climbing $200. Mistake 2: Ignoring divergence confirmation. Wait for a candle close beyond the trigger level before acting. Mistake 3: Using default 14‑period RSI on all timeframes without testing. Intraday traders often benefit from a 7‑ or 9‑period RSI to catch faster moves. Mistake 4: Relying on RSI alone without support/resistance. A divergence at a random price level is far less reliable than one at a well‑tested zone like $4,030.
Real Example on XAUUSD Chart – Spotting a Short Setup at $4,030
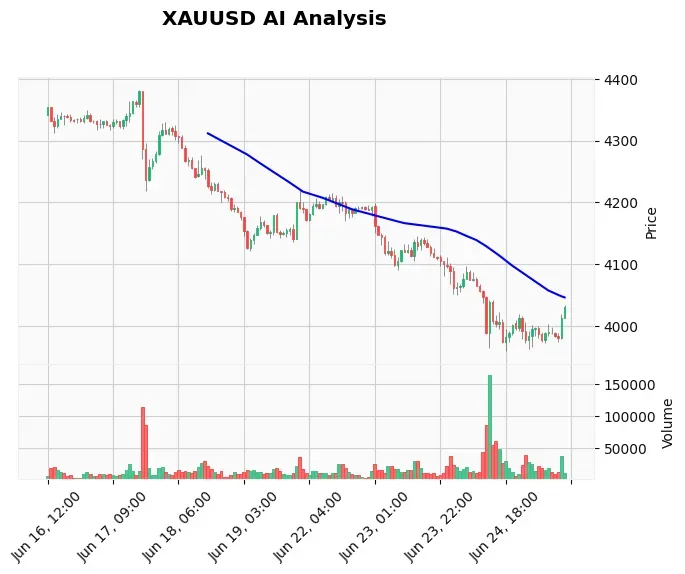
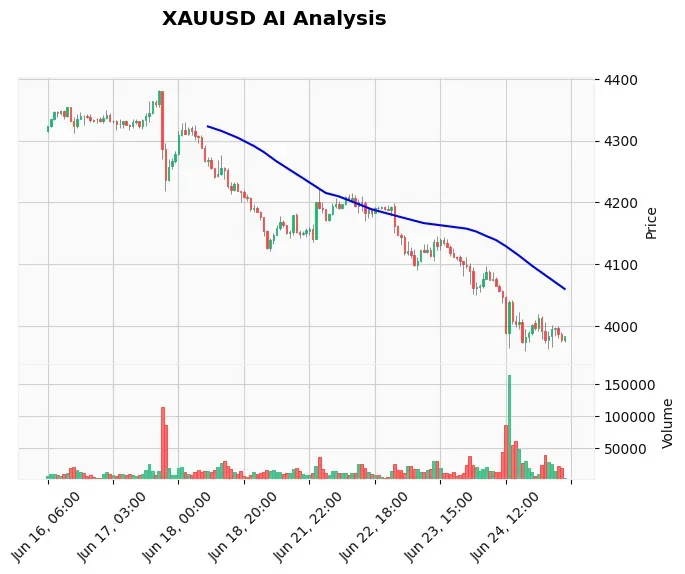
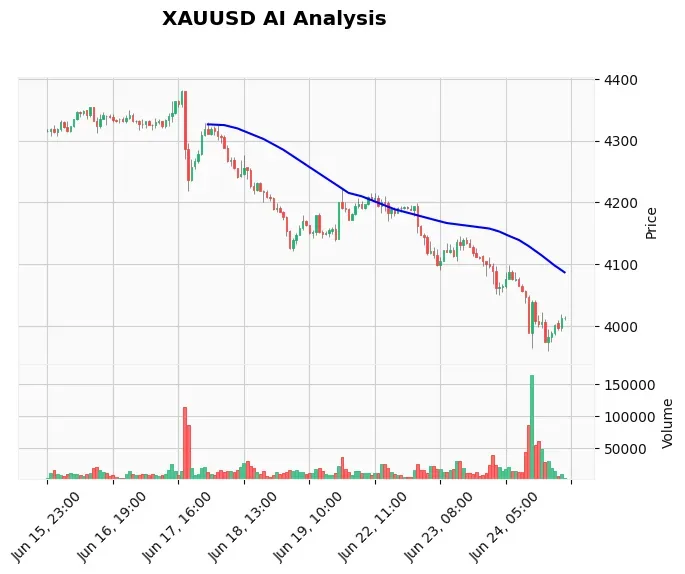
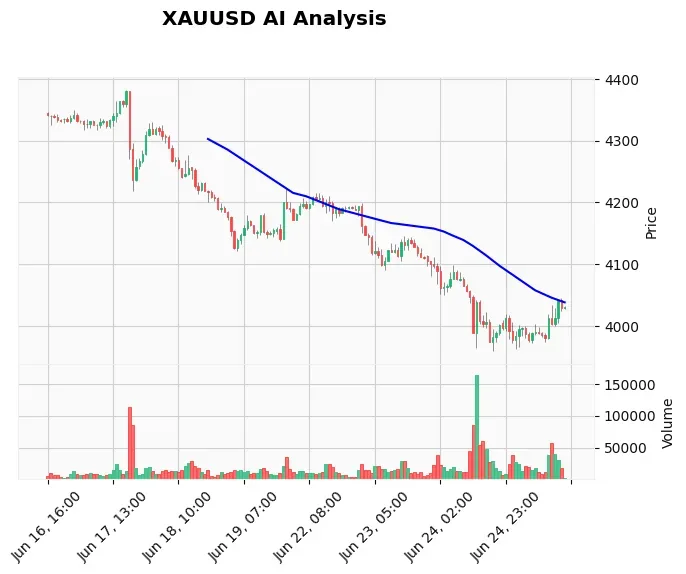
On June 25, 2026, XAU/USD is trading around $4,030. Looking at the H4 chart, price has posted a lower high compared to the $4,080 swing, while the RSI (14) has made an even lower high—a textbook bearish divergence. This tells us that buying pressure is weakening. The $4,030 level has acted as support multiple times; if it breaks, momentum should accelerate toward the $4,000 zone.
A short trade could be executed on a strong H4 close below $4,030, with a stop loss at $4,050 (above the recent consolidation top) and a profit target at $4,000. This setup has a clear risk‑to‑reward ratio. For traders who want to automate such RSI‑confirmed price‑action trades, our Price Action Pro EA runs continuously and applies smart‑money concepts with RSI filters to identify high‑probability entries exactly like this one.
FAQ
Q: What is the best RSI setting for Gold trading?
A: The standard 14‑period RSI works well for most Gold traders. Day traders and scalpers sometimes reduce it to 7 or 9 for quicker signals, and they may adjust the overbought/oversold thresholds to 80/20. Always back‑test your chosen settings against XAUUSD’s recent price action.
Q: How do I use RSI divergence to predict Gold reversals?
A: First, confirm the divergence on at least the H1 or H4 timeframe. A bearish divergence at a resistance level raises the odds of a reversal; a bullish divergence at support does the same. Enter only after a breakout candle confirms the reversal direction.
Q: Can I trade XAUUSD with RSI alone?
A: It’s risky. RSI works best when combined with trendlines, moving averages, or support/resistance levels. Using RSI by itself can lead to many false signals in a fast‑moving market like Gold. The $4,030 example shows how adding price structure turns a simple RSI signal into a high‑probability trade.
Q: Why does RSI stay overbought in a strong Gold uptrend?
A: A strong trend, driven by sustained buying, can keep RSI above 70 for extended periods. This is a signal of trend strength, not an automatic sell. Wait for a break of trend structure or momentum shift before considering a reversal trade.
Conclusion
RSI alone won’t make you a profitable Gold trader, but mastering its application—especially divergence and trend‑based thresholds—will give you a significant edge. The $4,030 level on XAUUSD right now is a perfect laboratory for testing these concepts. Practice identifying overbought/oversold zones, reading momentum, and always confirm with price action. Ready to take your Gold trading to the next level? Our AI Trading Bot uses machine learning to combine RSI, price action, and real‑time news, delivering high‑probability trades around the clock.
Risk Disclaimer
Trading Gold (XAU/USD) involves significant risk of loss. This content is for informational purposes only and does not constitute financial advice. Always conduct your own research and trade responsibly.