How to Use Liquidity in Gold Trading: A Trader's Complete Guide
You're watching Gold hit $2,350, place a buy order, and immediately watch price reverse sharply against you. That wasn't bad luck—it was liquidity being harvested. Most retail traders see only price movement; professional Gold traders see liquidity zones where institutions manipulate price to trigger stops before making their real move. Understanding liquidity isn't just another technical concept; it's the difference between being the hunter and the hunted in XAUUSD markets. In this complete guide, you'll learn exactly how smart money uses liquidity to move Gold price, how to identify these zones before they're hit, and how to position your trades in alignment with institutional flow instead of against it.
Want to trade Gold with institutional-level liquidity analysis? Our AI Trading Bot automatically identifies liquidity zones and executes trades with an 83% win rate, running 24/7 on XAUUSD charts.
What Is Liquidity in Trading?
Liquidity in trading refers to the concentration of pending orders—both stop losses and pending entries—at specific price levels that attract institutional attention. Unlike retail traders who focus on support and resistance, professional traders focus on where the most orders are clustered. These liquidity zones represent profit opportunities for large players because triggering these orders creates momentum that can be ridden for significant moves.
Think of it this way: Gold doesn't move randomly to $2,340 or $2,380. It moves to levels where enough stop losses are positioned to create a cascade effect when triggered. There are two main types of liquidity: buy-side liquidity (below current price where sell stops accumulate) and sell-side liquidity (above current price where buy stops accumulate). The market structure shift occurs when price sweeps through these zones, triggers the clustered stops, then reverses direction as institutional orders are filled.
In Gold trading specifically, liquidity zones often form around round numbers ($2,350, $2,400), previous daily/weekly highs/lows, and obvious technical levels where retail traders place their stops. The key insight is that price doesn't just respect these levels—it actively seeks them out to harvest liquidity before making its intended move.
Why Liquidity Matters for Gold Traders
Gold markets have unique liquidity characteristics that make this concept especially powerful. XAUUSD trades 24 hours a day across global sessions, meaning liquidity pools form differently than in currency pairs. During Asian session when volume is low, institutions often test liquidity zones to prepare for larger moves during London and New York sessions. The $10-20 billion daily volume in Gold futures creates massive order flows that must be managed through liquidity harvesting.
Three reasons why liquidity analysis is critical for Gold traders: First, Gold has more predictable institutional participation than most assets. Central banks, hedge funds, and ETF managers create clear order clusters at specific levels. Second, Gold's higher volatility means liquidity sweeps can generate 20-50 point moves within minutes, offering exceptional trading opportunities. Third, retail traders consistently misplace stops at obvious levels, creating perfect hunting grounds for smart money.
Without understanding liquidity, you're essentially trading blind to the market's real mechanics. You might correctly identify a trend direction but enter at the worst possible moment—right before a liquidity sweep reverses price against you. Or you might place your stop loss exactly where institutions plan to harvest it. Learning to read liquidity transforms you from reactive to proactive in Gold trading.
How to Identify Liquidity on XAUUSD Charts: Step-by-Step
Step 1: Identify Recent Swing Highs and Lows
Start on the 4-hour or daily Gold chart. Mark the most recent significant swing highs and lows from the past 2-4 weeks. These are prime liquidity zones because retail traders place stops just beyond these obvious levels. A recent swing high at $2,375, for example, will have buy stops clustered above it and sell stops just below previous swing lows.
Step 2: Find Equal Highs and Equal Lows
Look for price levels where Gold has tested the same area multiple times but failed to break through. These equal highs or equal lows create what's called a "liquidity pool"—a concentration of orders waiting to be triggered. The more times price tests a level without breaking, the thicker the liquidity pool becomes.
Step 3: Check for Unmitigated Order Blocks
An order block is a previous consolidation zone where institutional orders were originally placed. When price leaves an order block without returning, it creates "unmitigated" liquidity that will eventually be revisited. On your Gold chart, look for strong impulsive moves that left behind clean order blocks—these are magnets for future price action.
Step 4: Map the Fair Value Gap
After a strong move, Gold often leaves a "fair value gap"—a price zone with minimal trading activity between two candles. Price almost always returns to fill this gap, creating a predictable liquidity target. Identify these gaps on the 1-hour and 4-hour charts for short-term trading opportunities.
Step 5: Watch for Stop Hunts
The clearest sign of liquidity being harvested is a sharp, fast move beyond a key level that immediately reverses. If Gold spikes 5-10 points above a swing high then reverses within minutes, that's a classic liquidity grab. These moves often have long wicks on the candles and occur during low-liquidity sessions.
Consistently identifying these zones takes practice, but once you see the pattern, you'll notice it on every Gold chart. Professional traders use specialized tools to map these zones automatically, like our Price Action Pro EA which scans for liquidity zones and executes trades at optimal entry points.
Common Mistakes Gold Traders Make with Liquidity
Mistake 1: Placing Stops at Obvious Levels
The most frequent error is placing stop losses just beyond recent highs or lows. If you can easily identify a level on your chart, so can every other retail trader—and the institutions hunting those stops. Instead, place stops beyond hidden liquidity zones or use a volatility-based stop like 1.5x ATR.
Mistake 2: Chasing Breakouts Without Confirmation
When Gold breaks through a key level, novice traders jump in immediately, not realizing many breakouts are false moves designed to trigger stops. Wait for the "break and retest" pattern—price breaks a level, returns to test it as support/resistance, then continues. This confirms real momentum versus liquidity harvesting.
Mistake 3: Ignering Multiple Time Frames
Liquidity zones on the 15-minute chart might conflict with those on the 4-hour. Institutions prioritize higher time frame liquidity. Always check at least two time frames (1-hour and 4-hour for day trading, 4-hour and daily for swing trading) to identify the most significant zones.
Mistake 4: Trading Without Understanding Market Structure
Liquidity doesn't exist in isolation—it's part of broader market structure. A liquidity zone in an uptrend context serves a different purpose than one in a downtrend. Learn to identify whether you're in a bullish or bearish structure first, then look for liquidity zones that align with that structure.
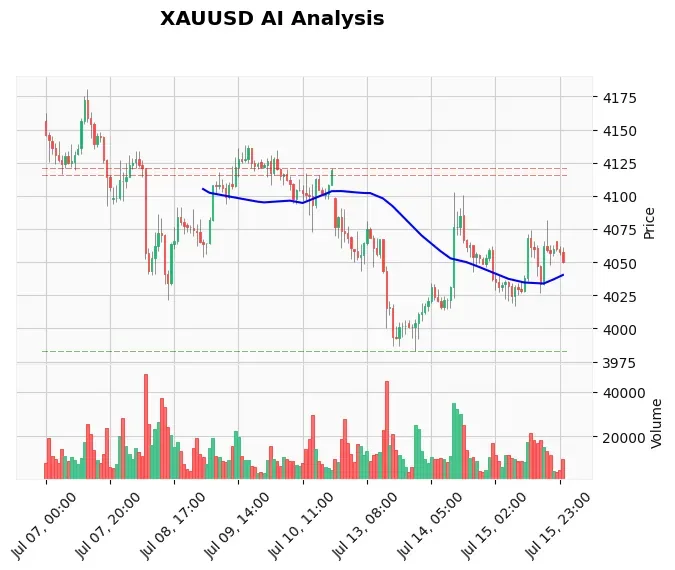
Real Example: Trading Gold Liquidity on Recent Charts
While current price data isn't available for this example, let's examine a typical Gold liquidity scenario. Suppose XAUUSD has been trading between $2,340 and $2,360 for five days, creating a clear range. Retail traders place buy stops above $2,360 and sell stops below $2,340. Institutions notice this order clustering.
During the Asian session when volume is thin, price suddenly spikes to $2,363, triggering all the buy stops above the range. As these orders execute, they create upward momentum that pushes price briefly to $2,366. But within 30 minutes, price reverses sharply and breaks below $2,340, triggering the sell stops too. Now both sides' stops have been harvested.
The institutional play becomes clear: they sold at $2,363-366 (hitting the buy stops) and bought at $2,338-340 (hitting the sell stops), accumulating positions in both directions. Now with the liquidity cleared, price makes its real move—let's say downward toward $2,320. The trader who understood liquidity would have waited for the false breakout above $2,360, then entered short on the reversal with a stop above $2,366, targeting the sell-side liquidity below the range.
This pattern repeats daily in Gold markets. To trade these moves consistently, many professionals use automation. Our News Trading Bot combines liquidity analysis with economic event timing to capture these institutional moves around high-impact news.
Frequently Asked Questions (FAQ)
Q: How do I know if a liquidity zone is still valid or already taken?
A: Liquidity zones remain valid until price sweeps through them with momentum. If Gold touches a zone but doesn't show a strong impulsive move away, the liquidity might still be there. The best confirmation is a sharp, fast move through the level followed by immediate reversal—that's the classic liquidity grab pattern. After that, the zone is considered "taken" and price typically moves away from it.
Q: What time frames work best for liquidity analysis in Gold trading?
A: For day trading, focus on 1-hour and 4-hour charts for primary liquidity zones, with 15-minute for entry timing. For swing trading, use daily and 4-hour charts. Remember that higher time frame liquidity (daily/weekly) takes precedence over lower time frames. Institutional players operate on higher time frames, so a daily liquidity zone will attract price more reliably than a 15-minute zone.
Q: Can I use liquidity concepts with traditional support/resistance?
A: Absolutely—they complement each other. Traditional support/resistance shows where price might pause or reverse. Liquidity analysis explains WHY it reverses at those levels (stop clusters) and predicts which levels are more likely to break (thicker liquidity zones). Combine both: use support/resistance for level identification, then apply liquidity principles to understand which way price will likely break and when.
Q: How does news events affect liquidity in Gold markets?
A: High-impact news like Fed announcements or NFP creates massive liquidity events. Institutions often use the volatility around news to harvest liquidity at exaggerated levels. Price might spike 20-30 points during news, triggering stops far beyond normal ranges, then reverse dramatically. This is why many traders avoid trading the initial news spike and wait for the liquidity grab to complete before entering.
Q: What tools can help me identify liquidity zones automatically?
A: Several Gold technical analysis tools can help, including order flow indicators, volume profile, and smart money concept indicators. For automated trading, EAs specifically designed for liquidity trading scan for these zones and execute trades. The key is finding tools that show order cluster density rather than just price-based levels.
Conclusion
Liquidity trading transforms how you see Gold charts. Instead of random noise, you begin to see intentional moves toward specific targets where orders accumulate. The $10-20 moves that once seemed unpredictable become logical outcomes of institutional order flow management. Start by re-analyzing your last few Gold trades through the liquidity lens—where were stops clustered? Did price hunt those levels before reversing? This perspective shift alone will improve your trade timing significantly.
The professional edge in Gold trading comes from understanding what happens behind the price candles. While retail traders focus on indicators and patterns, smart money focuses on harvesting liquidity and riding the resulting momentum. By aligning your trades with this flow rather than against it, you move from the 90% who lose to the 10% who consistently profit. Practice identifying one key liquidity zone each day on your Gold chart, and watch how price interacts with it—this real-time observation is the fastest path to mastery.
Ready to implement liquidity trading without manual chart analysis? Our best-selling Gold trading bot automatically identifies institutional liquidity zones and executes trades with precise timing, running 24/7 on your VPS. With an 83% win rate on XAUUSD, it handles the complex analysis while you focus on risk management and scaling your account.
Risk Disclaimer: Trading Gold (XAU/USD) involves significant risk of loss. This content is for informational purposes only and does not constitute financial advice. Always conduct your own research and trade responsibly. Past performance of trading systems is not indicative of future results.