Gold Trading Setup June 02 Asia: Bearish Momentum Targets $4,470 – Key Levels to Watch
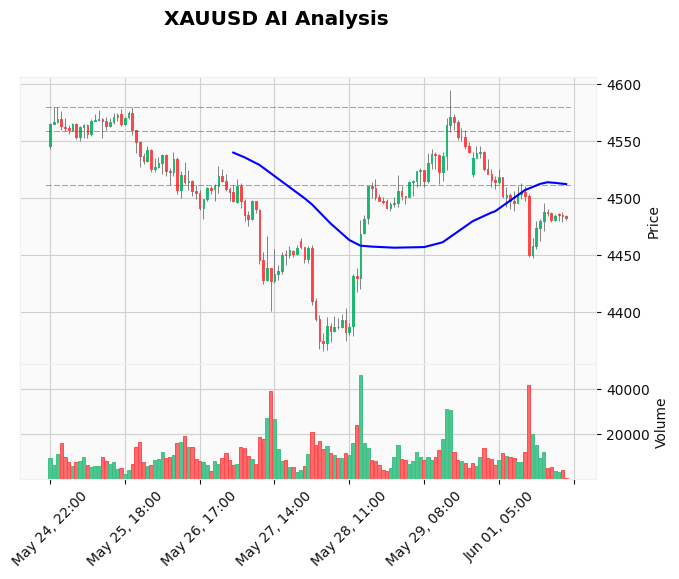
The Gold trading setup June 02 Asia opens with XAU/USD pinned near $4,481, extending Monday’s sharp decline that erased over 1% from gold prices. After losing the psychological $4,500 handle late in the New York session, bears are firmly in control, and the Asian morning shows no signs of a meaningful bounce. The breakdown accelerated when fragile US-Iran ceasefire talks lifted risk appetite and hoisted the US Dollar, crushing demand for the yellow metal. Overnight charts reveal a clean bearish structure, with short‑term moving averages sloping south and momentum oscillators pointing lower. For traders waking up to this setup, the message is clear: selling pressure is deepening, and the path of least resistance points toward $4,470. Those who want to automate this bearish sequence can let our AI Trading Bot manage entries and exits around these exact levels.
Gold Market Overview
The macro backdrop has turned decisively hostile for gold. Overnight headlines confirmed that a fragile ceasefire extension between the US and Iran is in progress, calming fears of an immediate military escalation and draining safe‑haven flows. As geopolitical tensions eased, the US Dollar Index (DXY) caught a bid, and benchmark Treasury yields crept higher, increasing the opportunity cost of holding non‑yielding bullion. Oil prices surged on lingering supply fears, yet the gold‑oil correlation broke down as the Dollar dominated. With no major Asian‑session data on the calendar, sentiment is expected to carry the bearish tone until European traders arrive. The market is now pricing in a hawkish Fed narrative, with ADP, ISM Services, and Average Hourly Earnings due later this week – all forecast to strengthen, which would only add fuel to the Dollar rally and pressure gold further.
Technical Analysis
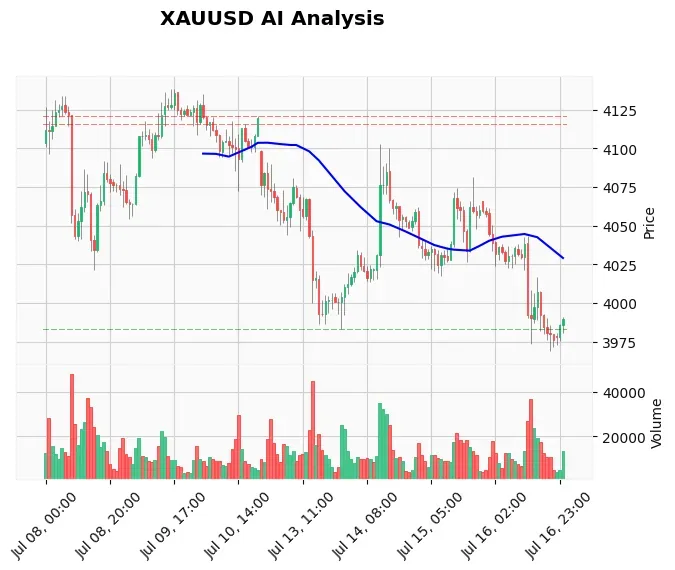
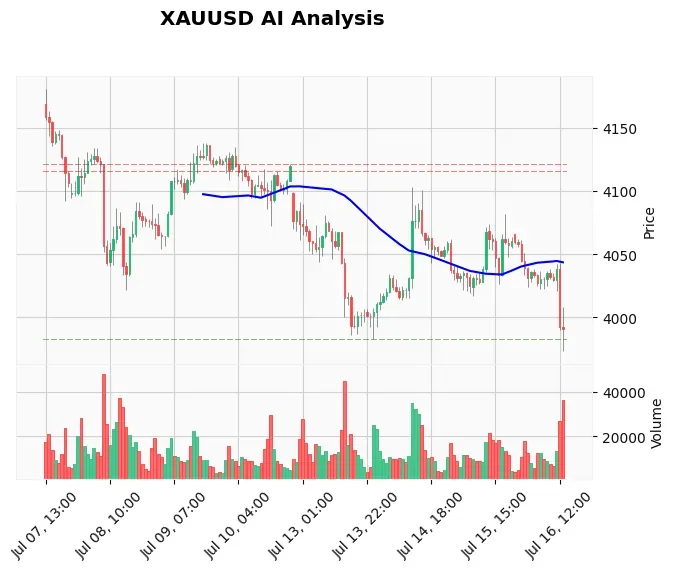
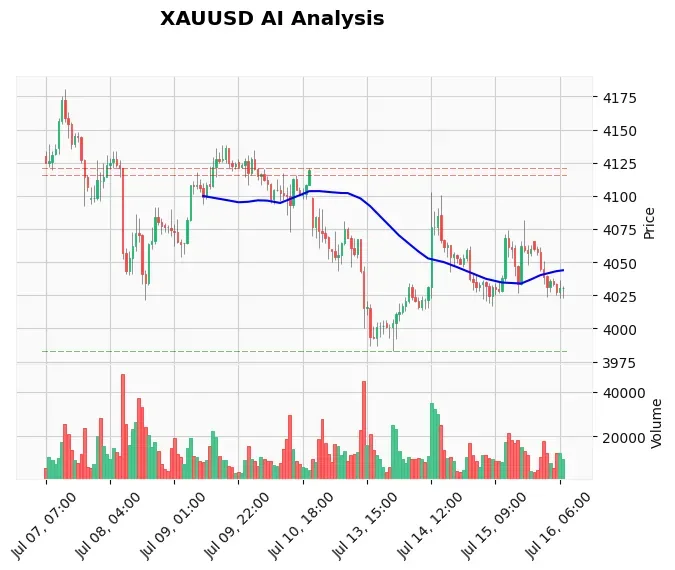
Technically, XAU/USD is painting a textbook bearish continuation pattern. Price is trading comfortably below the 20, 50, and 200 EMAs on the hourly chart – a clear death cross alignment. The 20 EMA sits at $4,491.54, the 50 at $4,497.80, and the 200 at $4,515.38, all acting as dynamic resistance now. The Relative Strength Index (RSI) reads 42.46, still in bearish territory and pointing lower without reaching oversold extremes, leaving room for additional declines. MACD prints a negative histogram at -8.88 with the signal line at -9.23, confirming momentum is accelerating south. Average True Range (ATR) of $16.08 suggests that the current swing can easily extend to the next support cluster.
Immediate support rests at $4,470 – the level where the existing sell signal from our Gold technical analysis tools is targeting a take‑profit. A break below that would open the path to $4,453.53 (S2 from our daily pivot model), and eventually the major structural floor at $4,366.29. On the upside, resistance begins at $4,492 – formerly support, now acting as a ceiling after the bearish break. A bounce toward $4,485‑$4,490 would likely attract fresh sellers. Only a firm 1‑hour close above $4,500 would challenge the short‑term bearish thesis.
Fundamental Drivers
The US‑Iran diplomatic track remains the pivotal theme. Any headline suggesting a breakdown of the ceasefire could spike gold back toward $4,500, but for now, the market is betting on de‑escalation. Adding to the bearish pressure, Friday’s US economic data – ADP private payrolls (forecast 118K vs. 109K prior), ISM Services PMI (forecast 53.8), and particularly Average Hourly Earnings – are expected to print strong, reinforcing the Fed’s justification for keeping rates higher for longer. With the CME FedWatch Tool already pricing virtually no chance of a rate cut this month, gold lacks the monetary policy cushion that typically fuels rallies. Traders who want to leverage these high‑impact data releases automatically can use our News Trading Bot to execute precise entries on XAU/USD around event times.
Devil's Advocate
No trade is foolproof. The bearish thesis invalidates if gold reclaims $4,500 and holds. A sudden collapse of the US‑Iran ceasefire – perhaps triggered by a fresh attack or a diplomatic breakdown – would instantly reverse risk sentiment, sending the Dollar lower and gold sharply higher. Equally, a catastrophic miss in the upcoming US data could force the Fed to signal a rate pause, removing the Dollar’s yield advantage. The level to watch on the hourly chart is $4,492: if bulls manage a decisive break above this former support, it would signal a short‑squeeze that could target the EMAs near $4,500. For now, the path of least resistance is lower, but any scenario shift would demand a swift re‑evaluation of positioning.
Trading Strategy for This Session
With the trend strongly negative, the optimal approach is to sell rallies, not chase breakdowns. Let price retrace towards the $4,485‑$4,490 resistance zone – an area that aligns with the hourly EMA cluster – before entering a short position. A safe stop loss can be placed above $4,500, giving enough room to avoid noise but confirming invalidation. The first take‑profit target is $4,470, while trail‑stop mechanics can aim for $4,465 and $4,453. For more aggressive intraday traders, a sell stop below the current session low of $4,476.66 can capture a fresh momentum breakdown, though this requires strict risk management due to potential whipsaws. To systematize these smart‑money entries, the Price Action Pro EA can identify order blocks and liquidity grabs around these levels with zero manual oversight.
Risk Management
Basing position size on the 16‑point ATR, a 20‑point stop loss above $4,500 from a $4,490 entry equals roughly 1.25 times the ATR – a sensible buffer. Traders risking 1% of their account should calculate lot size so that a 20‑point loss equates to that 1%. A minimum reward‑to‑risk ratio of 1:1.5 is achievable with the $4,470 target, and 1:2 if price extends to $4,465. Avoid averaging down in a losing short; if the trade moves against you and closes above $4,492, cut it and wait for the next clear setup.
FAQ
What is the gold price today in Asia on June 02, 2026?
As of the early Asian session, XAU/USD is trading around $4,481, down from the previous close and well below the $4,500 level that was breached overnight.
What are the key support and resistance levels for XAUUSD today?
Immediate support is at $4,470, with a secondary floor near $4,453 and a major structural base at $4,366. Resistance starts at $4,492 and extends to $4,500, with the hourly EMAs between $4,491 and $4,515 reinforcing the bearish boundaries.
Will gold go down further this week?
Based on the current technical breakdown and a strong fundamental headwind from a robust US Dollar and anticipated strong economic data, further declines toward $4,470 and possibly $4,450 are favored. A surprise dovish Fed signal or geopolitical shock could alter that outlook.
How to trade gold in a bearish market?
In a bearish environment, traders should look for selling opportunities at resistance levels after a retracement, rather than chasing new lows. Use a clear stop above the nearest swing high and target nearby support levels with a favorable risk‑reward ratio. Automated tools like Expert Advisors can help execute these plans without emotional interference.
Conclusion
Wednesday’s Asian session Gold trading setup leaves no doubt: bears have seized the wheel. The break below $4,500, the accelerating MACD, and the fundamental tailwinds for the US Dollar all argue for a continued slide toward $4,470 and potentially beyond. The $4,492‑$4,500 resistance band is the line in the sand – as long as price stays beneath it, the trend remains unambiguously short. Upcoming US data could dramatically amplify the move, but traders don’t need to wait. For those looking to capture these precise setups around the clock, our automated Gold robots – including the AI Trading Bot – specialize in trending markets just like this one.
Trading Gold (XAU/USD) involves significant risk of loss. This content is for informational purposes only and does not constitute financial advice. Always conduct your own research and trade responsibly.