Gold Trading Setup June 09 Asia: Sell-Stop at $4,309 Targets $4,280
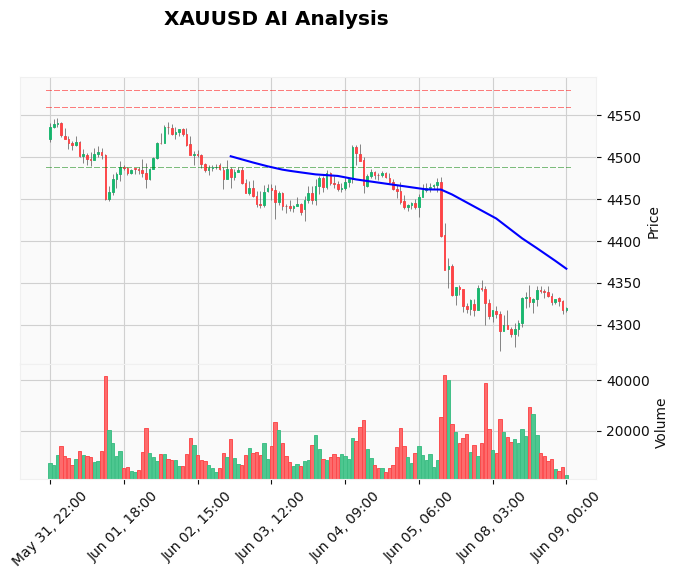
Gold trading setup June 09 Asia opens with sellers firmly in control. XAU/USD is changing hands at $4,320.06 after breaking below the critical $4,335 support zone, a level that now acts as formidable resistance. The early Asian session shows the metal trapped inside a descending channel, with lower highs and lower lows painting a clear bearish picture. With the US Consumer Price Index report just 36 hours away and investment banks forecasting a hot print, the fundamental backdrop reinforces the technical decline. Traders looking for a high-probability short entry will find a compelling setup forming near the $4,310 support region.
For those who prefer automated execution, our AI Trading Bot scans XAU/USD 24/7, following pre-defined rules like the sell-stop logic we outline today.
Gold Market Overview
Gold remains on the defensive below $4,350, weighed down by aggressive rate-hike expectations following last Friday’s blowout Nonfarm Payrolls report. The US Dollar Index is holding firm above 106.00, making the yellow metal more expensive for foreign buyers. Overnight, a tentative ceasefire between Iran and Israel lifted global risk appetite, stripping gold of its safe-haven bid. The combination of a resilient US labor market and easing geopolitical tensions has shifted the near-term sentiment decisively bearish. Asian traders are now positioning ahead of the US CPI release, where a print above forecasts could accelerate the sell-off toward the $4,100 region.
Meanwhile, China’s central bank held the USD/CNY reference rate at a steady level, but local gold premiums remain thin, indicating weak physical demand. The overall macro picture leaves little room for a sustained gold recovery during the Asian hours, with any bounce likely attracting fresh sellers.
Technical Analysis
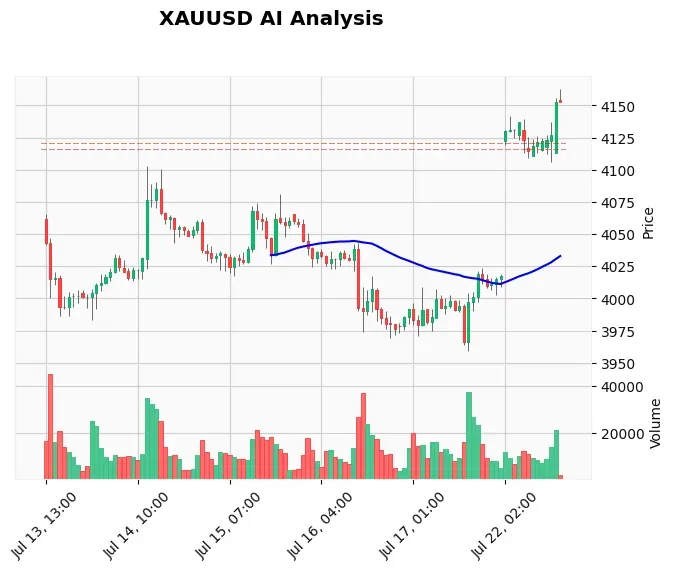
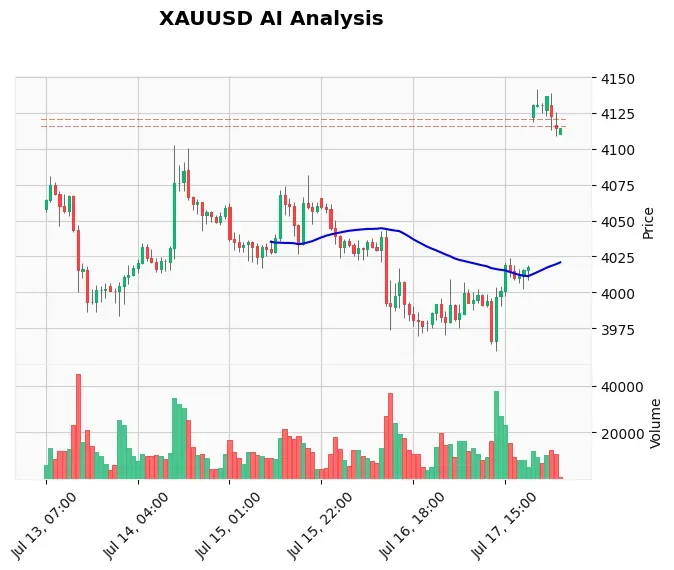
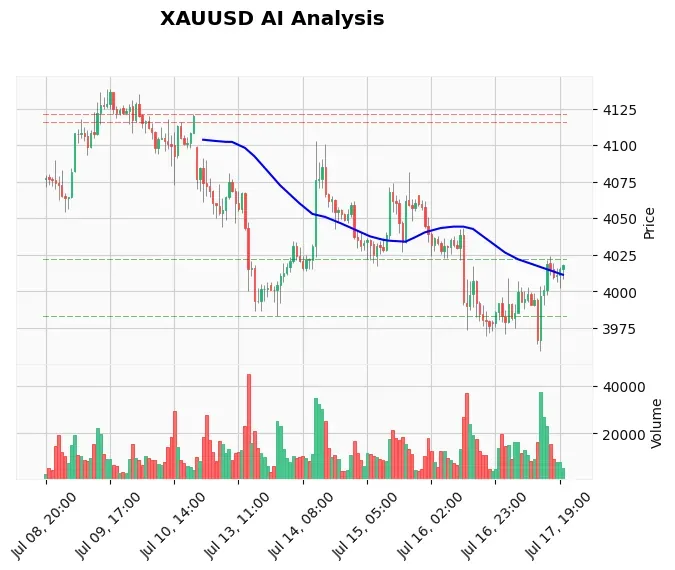
Our TradingView-powered analysis paints a bearish structure across all timeframes. On the 1‑hour chart, XAU/USD trades firmly below its 20‑period EMA at $4,329.12, the 50‑EMA at $4,360.40, and the 200‑EMA at $4,442.74. This bearish alignment confirms that every short-term bounce is a potential selling opportunity. The RSI sits at 42.29, still above oversold territory, indicating there is ample room for further declines before any meaningful correction. MACD reads –8.33 against a signal line of –11.70, with the histogram pointing south, signaling accelerating downside momentum. The Average True Range (ATR) of $17.62 suggests a daily range that comfortably accommodates the $310 target we are stalking.
Price is compressing inside a narrow corridor ahead of the CPI release, with immediate support at $4,310 – a multi-day low that acted as a floor last week. A convincing break below this level opens the door to $4,280, the next structural support, followed by $4,250. On the upside, the broken $4,335 zone now presents stiff resistance, while the next major ceiling from our automated tools sits at $4,515 (R1) and $4,541 (R2). You can track these levels in real time with our Gold technical analysis tools.
Fundamental Drivers
The most significant event on the horizon is Wednesday’s US CPI release, scheduled 35.5 hours from now. Ahead of the data, 15 investment bank analysts surveyed expect a hot print, with forecasts for headline CPI m/m at 0.5% and core CPI y/y at 2.9%. A number that meets or exceeds these estimates will reinforce the Federal Reserve’s hawkish stance, lifting real yields and crushing gold. Already, the odds of a rate hike at the next FOMC meeting have climbed, and the strong NFP data gave the Fed all the cover it needs to stay aggressive.
Adding to the bearish cocktail, the Iran-Israel ceasefire removed a key risk premium. Gold had rallied into the $4,500s on war fears; that unwind is still in progress. Unless the ceasefire collapses, safe-haven flows will likely remain dormant. The net effect is a fundamental environment that aligns almost perfectly with the technical downtrend, leaving metals traders little reason to buy today.
Devil’s Advocate
If the US CPI data surprises to the downside, or if the ceasefire falls apart overnight, the bearish bias could evaporate rapidly. A sudden dovish repricing would likely trigger a short squeeze back above $4,335. In that scenario, the sell-stop at $4,309 would not be triggered, and a reversal toward $4,350 and even the 50‑EMA at $4,360 would gain traction. Additionally, month-end physical demand from central banks could provide a stealth bid that catches short sellers off guard. The invalidation point for the bearish view is a daily close above $4,335; without that, the downtrend remains intact.
Trading Strategy for This Session
The plan is straightforward: place a sell-stop order at $4,309.00, just below the $4,310 support, to catch a breakdown during the Asian or early European hours. The stop loss sits at $4,335.00, above the former support-turned-resistance, providing a 16‑point risk cushion. The primary take-profit target is $4,280.00, with a secondary target at $4,250.00. This setup offers a risk-to-reward ratio of approximately 1:2 at the first target. For those who trade manually, a pending sell-stop ensures you don’t chase the move lower.
Automation simplifies the execution. Our Price Action Pro EA for Gold can manage these entries automatically, placing stop orders, trailing stops, and multiple take-profit levels without manual intervention.
Risk Management
Position sizing is critical when trading ahead of high-impact news. With an ATR of $17.62, a 26‑point stop (from entry to SL) represents about 1.5 times the average daily range, which is appropriate for a breakout trade. Never risk more than 1‑2% of your account on a single setup. If the trade is triggered, consider moving the stop to breakeven after the first target is hit to protect capital. Aggressive traders can tighten stops once price moves 10‑15 points into profit. Above all, accept that a CPI‑driven volatility spike can cause slippage; use guaranteed stop-losses if your broker offers them, or reduce position size accordingly.
FAQ
What is the gold price outlook for the Asian session today?
The Asian session outlook is bearish, with XAU/USD trading below $4,335 resistance. Immediate support at $4,310 is critical; a break points to $4,280. The market is consolidating ahead of US CPI data, so expect low-volume drift with a negative bias.
Why is gold falling in early Asian trade?
Gold is falling because of strong US jobs data, rising rate-hike expectations, a firmer US Dollar, and reduced geopolitical risk following the Iran-Israel ceasefire. These factors collectively remove the bid for safe havens and push yields higher, making non-yielding gold less attractive.
What are the key levels for XAUUSD on June 9?
Key levels: resistance at $4,335 (broken support), followed by $4,423 and $4,515. Support at $4,310, then $4,280 and $4,250. A break below $4,310 confirms continuation; a move above $4,335 would shift the bias neutral.
How does the upcoming CPI data affect the gold trading setup?
The CPI report, due in about 36 hours, is the primary catalyst. A hot print will likely accelerate gold’s decline toward $4,100, validating the short bias. A weak number could reverse the trend, invalidating the sell-stop strategy and triggering a rally back above $4,335.
Conclusion
The Asian session hands gold traders a clear bearish roadmap. Price is trapped below $4,335, momentum indicators are stacked against the metal, and the fundamental countdown to a potentially hot CPI release keeps buyers on the sidelines. The $4,310 level is the gatekeeper; once broken, the path to $4,280 and $4,250 opens swiftly. This structured sell-stop at $4,309 with a 26‑point risk offers a high-probability entry for traders who respect the trend. Let the market do the work—or let automation handle it: our automated Gold bot with 83% win rate can execute this very strategy while you sleep.
Trading Gold (XAU/USD) involves significant risk of loss. This content is for informational purposes only and does not constitute financial advice. Always conduct your own research and trade responsibly.