Gold Trading Setup June 11 Asia: $4,080 Resistance, $4,000 Target
Gold collapsed below the March low of $4,097 overnight, plunging to $4,045 amid a double-barrel blast of sticky US inflation and escalating military strikes on Iran. This Gold trading setup June 11 Asia examines the current market structure and presents a tactical short opportunity as the metal revisits key resistance levels. The breakdown has been violent, slicing through the 38.2% Fibonacci at $4,079.35; however, the Asian session is seeing a corrective bounce, offering disciplined traders a chance to sell rallies. For those wanting to act on this setup without staring at charts, our News Trading Bot automatically executes trades around high-impact events like today’s upcoming PPI data.
Gold Market Overview
The macro picture for gold remains overwhelmingly bearish. The May US Consumer Price Index printed at +4.2% year-on-year, matching expectations, but details revealed persistent core inflation, locking in Federal Reserve rate-hike expectations. Compounding the pressure, the US launched fresh airstrikes on Iran following President Trump's warnings, sending crude oil prices sharply higher. In a twist, geopolitical turmoil is boosting the US dollar and Treasury yields as global safe-haven flows favor the greenback over gold. The DXY surged to multi-month highs, while real yields climbed, making non-yielding gold prohibitively expensive to hold. The result: XAU/USD shed over 3.5% on Wednesday, its worst single-day drop in months, accelerating an already-established downtrend. Asian trading on Thursday has seen a tentative bounce from the $4,036 low, but the prevailing sentiment is “sell rallies.”
Technical Analysis
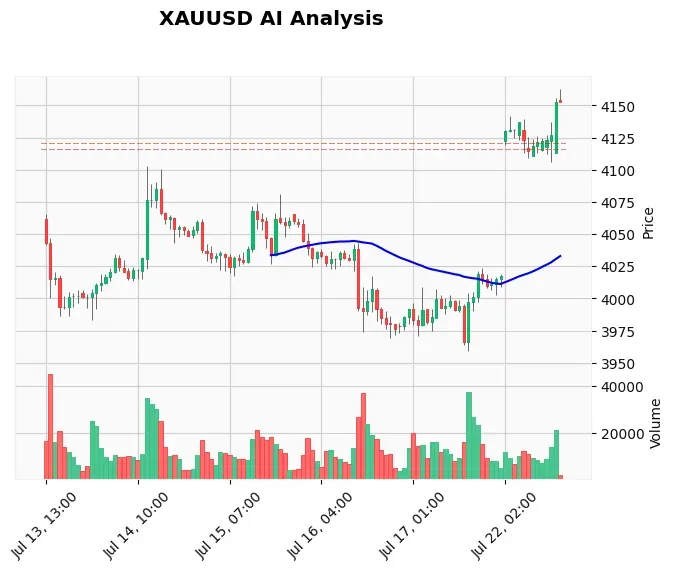
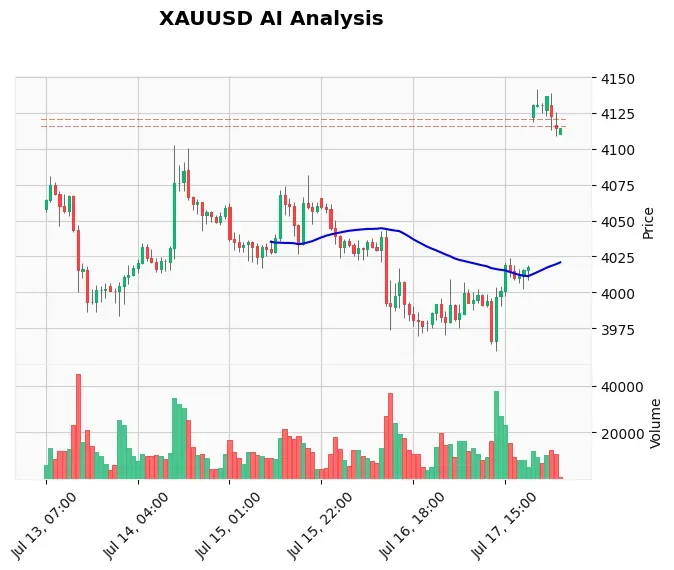
From a technical standpoint, XAU/USD is deeply bearish on all timeframes. The 1-hour chart shows a clean break below the March swing low of $4,097, turning that zone into formidable resistance. The EMA ribbon — 20-period at $4,127.60, 50-period at $4,203.62, and 200-period at $4,356.22 — sits well above current price, confirming bearish momentum. RSI at 31.29 indicates oversold conditions are approaching but not yet extreme, leaving room for further downside. MACD histogram remains negative with the signal line at -43.82. The Average True Range (ATR) of 29.80 points highlights a high-volatility environment, where moves of $30-$40 within a session are normal.
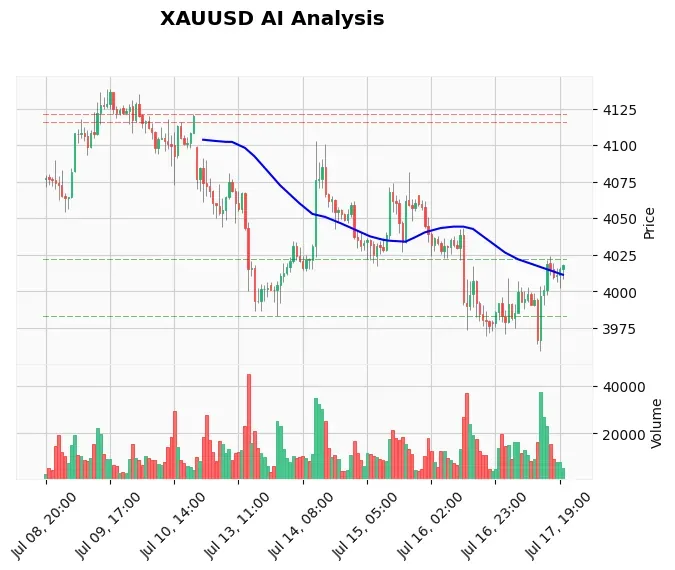
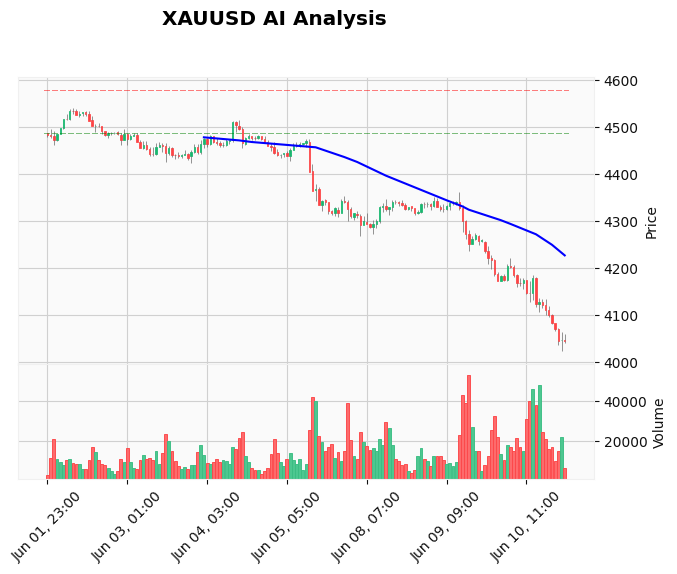
The corrective bounce from $4,036 toward $4,076 is encountering selling interest near the 38.2% Fibonacci retracement of the September 2022–2025 rally at $4,079.35. This level, along with the psychological $4,080–$4,100 band, now serves as the primary resistance cluster. On the downside, immediate support rests at $4,040, followed by the round number $4,000 — a magnet for bears. A breakdown there would expose the November 2025 low around $3,960. The daily chart’s peak in late May near $4,535 now looks like a distant memory, underscoring the bearish market structure.
Fundamental Drivers
Inflation data was the main catalyst. While headline CPI met forecasts, core components stayed stickier than the Fed prefers, reinforcing the “higher for longer” rate narrative. Markets now bake in multiple additional rate hikes. Adding fuel to the fire, Trump’s Iran strikes sent oil prices soaring, which in turn feeds price pressures and justifies further tightening. Upcoming US PPI data in about 11.5 hours — Core PPI forecast at 0.5%, headline PPI at 0.7% — could amplify the sell-off if numbers surprise to the upside. For traders who want to capture the PPI reaction instantly, our Price Action Pro EA is built to read order flow and execute at lightning speed.
Gold’s role as a safe haven is being overridden by the dollar’s safe-haven bid. Real yields are climbing at a pace that makes gold’s zero-yield nature a liability. The correlation between gold and the VIX has broken down, as the “Trump trade” boosts energy and defense stocks while punishing metals.
Devil’s Advocate
The bearish thesis is strong, but traders must watch for invalidation signals. If gold manages to reclaim the $4,100 level and hold above it — especially after a soft PPI print — a short squeeze could develop. A sudden de-escalation in the Iran conflict or a dovish Fed surprise would also pressure the dollar and lift gold. However, as long as price remains below $4,080–$4,100, the trend is your friend. The Asian session’s bounce is likely a technical correction, not a reversal.
Trading Strategy for This Session
The Asian session offers a high-probability short setup. Look to sell on rallies into the $4,078–$4,080 zone, the area where the Fibonacci level intersects with the prior low. Place a stop loss above $4,082, just above the resistance cluster, to guard against a false breakout. The initial take-profit target is $4,001.50, near the psychological $4,000 handle. This setup provides a risk-reward ratio of roughly 1:2.5 (risking $4 to gain $25-$30). If you prefer a fully automated approach, our Cloud Copy Trading platform mirrors professional gold trades directly to your account.
Risk Management
With ATR elevated at $29.80, position sizing must be conservative. Risk no more than 1% of your account on this trade. Consider reducing position size ahead of the US PPI release, as whipsaw risk is high. If price trades below $4,040 decisively, a trailing stop can protect profits while letting the trade run toward $4,000. Also, ensure your broker’s margin settings account for the increased volatility.
What is the gold trading setup for June 11 Asia?
The primary setup is to sell rallies toward the $4,078–$4,080 resistance zone, targeting $4,001.50. A bearish market structure, sticky US CPI, and upcoming PPI data support further downside. A stop above $4,082 protects against invalidation.
Why did gold break below $4,097?
The March low gave way after May CPI data reinforced Federal Reserve rate-hike bets and Trump’s military strikes on Iran boosted the US dollar and bond yields. The breakdown was accelerated by stop-loss hunts and algorithmic selling.
What are the key XAUUSD levels in the Asian session?
Resistance sits at $4,079.35 (Fibonacci) and $4,100. Support lies at $4,040 (intraday) and $4,000 (psychological). A close above the resistance area would shift bias, while a break below $4,040 could open the door to $4,000.
Is it safe to short gold before the US PPI data?
Shorting before high-impact data carries elevated risk of whipsaws. Use tight stops and reduce position size. If PPI comes in hotter than expected, the trade could accelerate to the target; a miss could trigger a sharp short-covering rally. Advanced traders may wait for the data release and then sell after a failed test of resistance.
Conclusion
The gold market is in freefall, with $4,000 now the next logical destination. The Asian session bounce provides a well-defined entry area around $4,080, where sellers are likely to defend the broken support. As long as the CPI-driven hawkish repricing holds and the Iran situation fuels dollar demand, the path of least resistance remains downward. For traders who cannot monitor the market 24/7, our AI Trading Bot autonomously manages risk and captures these XAU/USD moves with a consistent 83% win rate.
Trading Gold (XAU/USD) involves significant risk of loss. This content is for informational purposes only and does not constitute financial advice. Always conduct your own research and trade responsibly.