Gold Price Today July 03 2026 Europe: NFP Surge Eyes $4,200
Gold is ripping higher this European morning, trading around $4,177 after yesterday’s disastrous US jobs report crushed rate‑hike expectations. XAU/USD is grinding toward the key $4,200 level, even as profit‑taking near resistance keeps the immediate breakout in check. The bullish trend on the hourly chart is unbroken, and fundamentals remain firmly behind the precious metal. For traders, the setup is clear: manage the near‑term overbought signal and position for a continuation above $4,200. Running a strategy like this manually is demanding, but our best-selling Gold trading bot executes these levels automatically, 24/7.
Gold Market Overview
The European session has opened with a bullish pulse, echoing the risk‑on flow for gold seen after the US Non‑Farm Payrolls print. The Dollar Index is struggling near weekly lows, and Treasury yields continue to slide. That’s the exact cocktail that pushes non‑yielding bullion higher. With no high‑impact USD events on today’s calendar, the macro narrative can breathe. Markets are pricing the Fed firmly on hold, and UBS analysts reinforced that view this morning, dismissing residual tightening fears. Until next week’s inflation data, gold has a clear path to extend its recovery, provided the $4,200 barrier gives way.
Technical Analysis
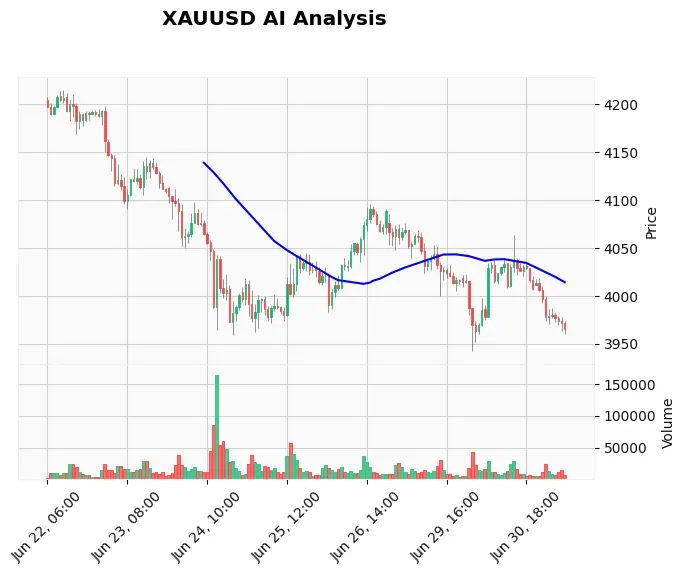
The hourly chart leaves little doubt about direction. The EMA stack sits in a textbook long configuration: the 20‑period EMA at $4,172.36 holds above the 50‑period EMA at $4,156.26, which in turn towers over the 200‑period EMA at $4,097.31. Price is trading comfortably above all three moving averages and the session VWAP, confirming strong intraday demand. The RSI on H1 reads 60.10, well away from overbought territory despite the rally, meaning there’s still fuel for another leg. The MACD is printing a reading of 4.74 versus a signal line of 6.05 — a mild bearish crossover that hints at fading momentum, but the bullish trend remains intact as long as the histogram doesn’t collapse below zero. ATR sits at 7.48, so expect swings of roughly 75 pips in a normal session.
The real battle is the resistance cluster just ahead. The immediate ceiling is the $4,195.51 R1 pivot, closely followed by the psychological $4,200 round number and the prior weekly high at $4,221. On the downside, support starts at $4,172 (coinciding with the 20 EMA), then $4,156 (50 EMA), with the swing low and our stop‑loss zone around $4,148‑4,144. The daily chart still keeps the 200‑DMA far above at $4,338.67, so the recovery has room, but the shorter‑term structure suggests we’ll see a consolidation before any explosive break. The chart confirms trendline breakouts on lower timeframes, so the path of least resistance is up, but at a measured pace.
Fundamental Drivers
Yesterday’s NFP miss was the spark. The US economy added far fewer jobs than expected, sending the US Dollar into a tailspin and bond yields crashing lower. That single data point killed any lingering hawkish dreams, and the narrative flipped to a Fed on pause long enough to make non‑yielding assets shine. UBS explicitly stated that markets are overpricing tightening risks, aligning with the view that gold’s current rally is built on solid macro ground. Soft data reduces the opportunity cost of holding gold, and safe‑haven demand is being buttressed by fragile sentiment in equity markets.
With no high‑impact US events scheduled for the rest of today, the fundamental backdrop remains supportive. That said, thin liquidity ahead of the weekend could amplify moves, especially if stops above $4,200 are triggered. Traders who want to capitalise on these sudden spikes often turn to an automated Gold news bot, which reacts to headlines faster than any manual trader can.
Devil’s Advocate
The main risk today is a rejection at the $4,195‑4,200 band. If bulls repeatedly fail to clear that zone, profit‑taking will accelerate. A move back below $4,172 would open a retest of $4,156 and potentially the $4,148 stop‑cluster. Below $4,144, the short‑term bullish structure breaks down, and a swift drop to $4,100 becomes plausible. The overbought 4‑hour RSI of 70.11 supports the idea that a pullback is due, but strong fundamentals usually delay corrections until after a final push.
Trading Strategy for This Session
The ideal trade is already running. The existing long entry at $4,178.57, with a stop at $4,148.57 and a target of $4,220, captures the expected move while staying within the 300‑pip risk framework. For traders not yet in, a pullback toward the $4,170‑4,172 zone offers a textbook entry, with a stop below $4,148 and a target at $4,195 initially, then $4,220. The risk‑to‑reward of about 1:2 remains attractive. Manually monitoring these levels across multiple timeframes is tough, but our Price Action Pro EA scans SMC zones and executes entries precisely, removing emotion from the equation.
Risk Management
With an ATR of 7.48, position sizing should account for a 75‑pip daily swing. A 2% account risk means calculating lot size based on a 30‑pip stop (entry to stop distance). For a $10,000 account, that limits position size to about 0.06 lots on a standard account, keeping the dollar risk within control. If you’re running automated strategies, running them on a low-latency MT4 VPS ensures your trades execute without interruption even during power outages or connection drops.
FAQ
1. What is driving gold price today July 03 2026?
The main driver is the weak US Non‑Farm Payrolls report released yesterday, which crushed expectations for additional Fed rate hikes. That sent the US Dollar sharply lower and Treasury yields falling, boosting the appeal of non‑yielding gold. With no high‑impact data today, the rally is sustaining on safe‑haven demand and a macro backdrop that favours gold.
2. Can gold break above $4,200 this session?
It’s possible, but it will require a clear hourly close above the $4,195‑4,200 resistance cluster. The trend is bullish and fundamentals support the move, but the 4‑hour chart is overbought, which could cap the breakout. A strong US Dollar reversal or unexpected hawkish headline would also halt the advance. The key is watching whether buyers can absorb selling pressure at this level.
3. What is a good entry level for gold today?
A pullback to the $4,170‑4,172 area, where the 20‑period EMA sits, offers a solid risk‑defined entry. A stop below $4,148 keeps the trade alive while respecting the swing low, and initial targets can be set at $4,195 and then $4,220. Avoid chasing right at resistance unless you’re comfortable with a wider stop.
4. Is it too late to buy gold at current prices?
No, but position sizing and stop placement become even more critical. The medium‑term trend remains bullish, supported by the fundamental backdrop, but the near‑term risk of a rejection at $4,200 must be managed. Using a disciplined entry on a dip, rather than jumping in at the highs, provides a better risk‑reward profile.
Conclusion
The XAU/USD chart tells a straightforward story today: bulls are in control, but $4,200 is the gatekeeper. Above it, $4,221 and ultimately the daily 200‑MA at $4,338 come into play. The combination of a weak US Dollar, crumbling rate‑hike bets, and a technical uptrend creates a compelling case for staying long. That said, patience near the resistance zone will pay off. A dip to the EMA support will bring a cleaner entry, while a confirmed breakout above $4,200 would trigger a fresh wave of momentum. Letting an AI-powered XAU/USD bot handle the timing and execution frees you to focus on the big picture and avoid the noise of intraday fluctuations.
Trading Gold (XAU/USD) involves significant risk of loss. This content is for informational purposes only and does not constitute financial advice. Always conduct your own research and trade responsibly.