Gold Price Today June 23 2026 Europe: Is $4,100 the Next Target?
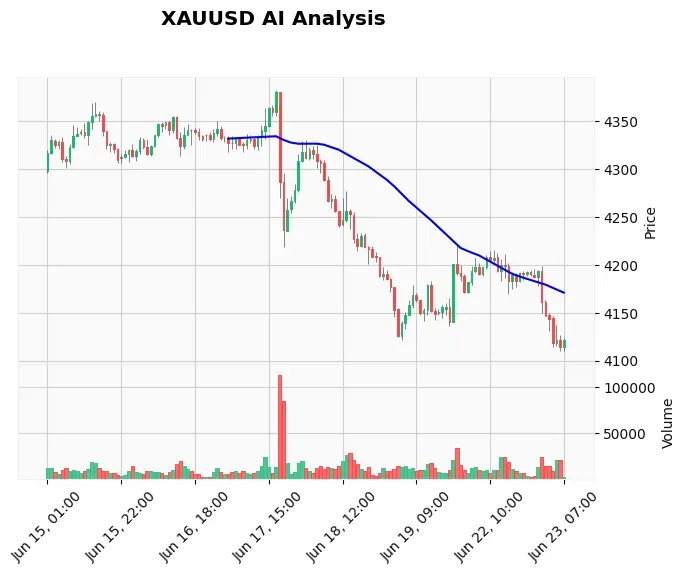
Gold (XAU/USD) is trading near its lowest levels in two weeks, hovering just above the psychological $4,100 handle as the European session gains momentum. After breaking below $4,120 earlier today, the yellow metal faces relentless pressure from a strong US Dollar and renewed hawkish Federal Reserve expectations. With the Gold price today June 23 2026 Europe showing no signs of a meaningful recovery, traders are asking: is $4,100 the next stop?
If you want to capitalize on these high-probability Gold moves without staring at charts all day, our AI Trading Bot runs 24/7 on XAU/USD and currently holds a bearish stance with an 83% plus win rate.
Gold Market Overview
The European session opened with Gold firmly on the back foot, extending losses that started in Asia. XAU/USD is changing hands at $4,098.90, down over 1% on the day, as the DXY remains bid above 104.00. Hawkish commentary from Fed officials continues to dominate the narrative, reinforcing bets that the central bank will keep rates higher for longer. Markets are pricing in a fresh round of tightening, drowning out any residual safe-haven demand.
Adding to the selling pressure, progress in U.S.-Iran nuclear talks has further eroded Gold’s safe-haven premium. With no high-impact US data due for more than 52 hours, the path of least resistance remains to the downside. The quiet economic calendar leaves sentiment-driven price action squarely in control, and that sentiment is unequivocally bearish.
Technical Analysis
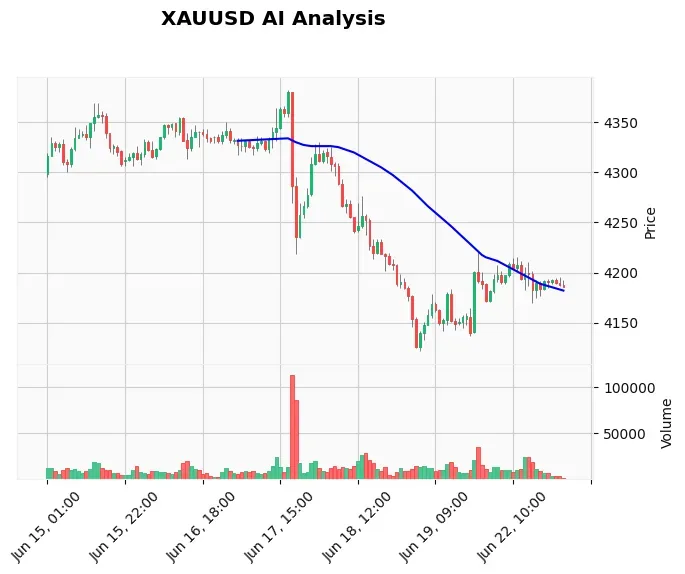
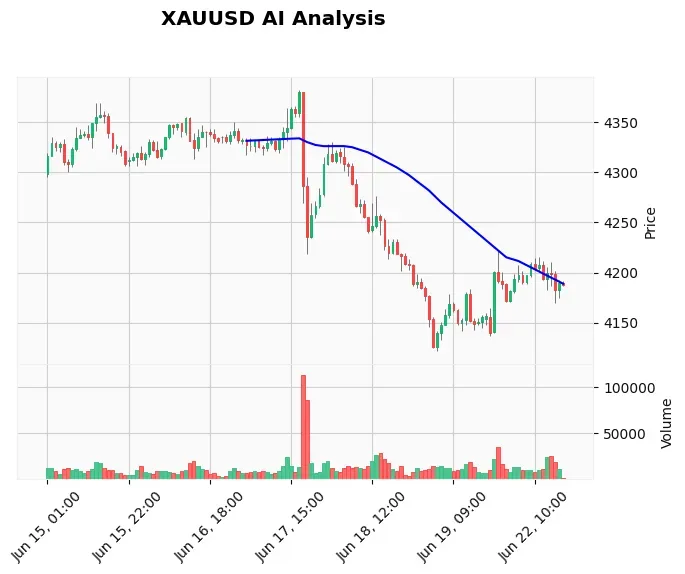
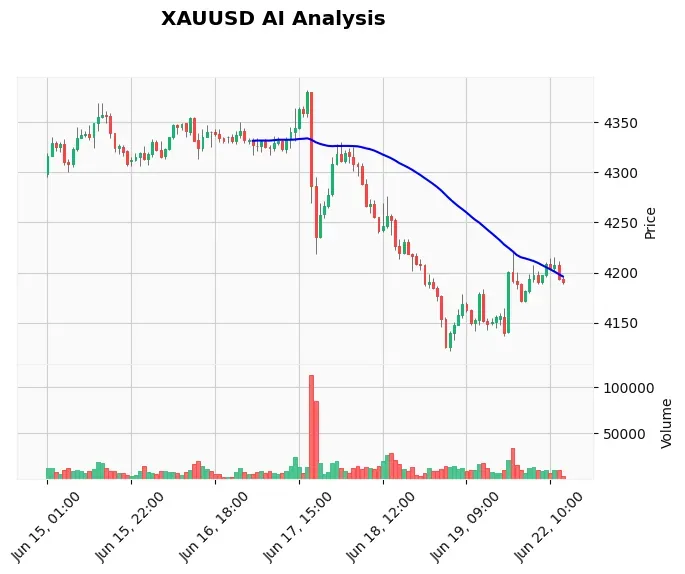
From a technical perspective, Gold is deeply entrenched in a downtrend across multiple timeframes. The hourly chart shows a clear series of lower highs and lower lows, with price trading well below its key moving averages: 20 EMA at $4,157.33, 50 EMA at $4,182.30, and 200 EMA at $4,247.51. The gap between spot and these EMAs is widening, confirming strong bearish momentum.
The Relative Strength Index (RSI) sits at an oversold 24.77, yet it has not diverged positively, suggesting that the selling may continue before any meaningful bounce. MACD is also deeply negative at -19.46, below its signal line at -10.23, with no sign of convergence. The Average True Range (ATR) of $19.89 indicates that daily swings of around $20 are normal, giving intraday traders manageable volatility for short-term setups.
Key levels from our TradingView webhook: immediate resistance stands at $4,121.58 (former intraday support now turned resistance), with a more distant barrier at $4,220.98. On the downside, a break below $4,096.57 (today's low) would open the door to the psychologically critical $4,100–$4,090 zone, with secondary support only emerging at $4,023.76. For traders relying on automated strategies, the Price Action Pro EA can seamlessly execute these supply-and-demand setups on XAUUSD.
Fundamental Drivers
The bearish case for Gold this week is built on two solid pillars: aggressive Fed expectations and a resilient US Dollar. FOMC members have repeatedly signaled that inflation is not yet tamed, hinting at additional rate hikes. This has pushed US Treasury yields higher, making the non-yielding Gold less attractive. At the same time, a diplomatic breakthrough between the US and Iran has removed a major geopolitical risk premium, further undermining Gold’s safe-haven appeal.
Silver (XAG/USD) is also falling, trading near seven-month lows, which confirms that the precious metals complex is under broad selling pressure. While the Core PCE Price Index and final GDP readings are still two days away, the pre-event environment is already punishing Gold longs. To stay ahead of such high-impact news, many traders rely on the News Trading Bot to automatically capture spikes during economic releases.
Devil's Advocate
No trend moves in a straight line, and the extremely oversold RSI could provoke a short-covering rally. If Gold manages to reclaim $4,126.61 (the entry level of our short trade) and close an hourly candle above it, the bearish structure would weaken. A subsequent push above $4,145–$4,157 (the previous resistance and 20 EMA) would shift the short-term bias back to neutral, possibly triggering a squeeze toward $4,182. Traders must respect this invalidation point and adjust stops accordingly.
Trading Strategy for This Session
For traders not yet positioned, the European session offers a clear short opportunity on any intraday bounce. The ideal entry zone lies between $4,115 and $4,125, where former support has flipped into resistance. A stop loss above $4,130 (just above today's swing high and the breakeven level) protects against a false breakout. The primary target is $4,100, with a secondary objective of $4,080. Given the ATR of $19.89, a 1:3 risk-reward ratio is easily achievable.
Existing short positions from higher levels can now be managed more aggressively: move the stop loss to breakeven at $4,126.61 to lock in a risk-free trade, and keep the take profit at $4,100. This is exactly the modification our AI analysis log suggests today. If you prefer to let an algorithm handle such adjustments automatically, combine your chart analysis with the Telegram signal copier to mirror professional Gold trades directly to your MT4/MT5 account.
Risk Management
With an invalidation level clearly defined at $4,130, position size can be calculated so that no more than 1–2% of the trading account is at risk. For example, on a $10,000 account, risking $100–$200 with a 20-point stop means trading 0.5 to 1.0 lots. Keep in mind that Gold can gap over weekends or during news events, so never leave positions unmonitored. Always use hard stops.
Frequently Asked Questions
What is the gold price in Europe today?
Gold (XAU/USD) is trading at $4,098.90 as of the European session open on June 23, 2026, holding near a two-week low after breaking below $4,120 earlier in the day.
Why is gold falling despite an oversold RSI?
An oversold RSI reflects the speed of the decline, not necessarily an imminent reversal. Strong bearish fundamentals – hawkish Fed bets, rising USD, and easing geopolitical tensions – continue to drive selling, and the RSI can stay oversold for extended periods in a downtrend.
What are the key XAUUSD levels to watch today?
Immediate resistance sits at $4,121.58 (intraday pivot), followed by $4,145–$4,157. On the downside, a break below $4,096.57 targets $4,100, with secondary support at $4,023.76.
Should I short gold in the European session?
A short trade can be considered on a rally to $4,115–$4,125, with a stop above $4,130 and targets at $4,100 and $4,080. Wait for a clear rejection of the resistance zone before entering, and always manage risk proactively.
Conclusion
The Gold price today June 23 2026 Europe is under intense selling pressure, driven by a powerful combination of hawkish monetary policy expectations and a strong US Dollar. The technical picture is unequivocally bearish, with price trading well below all major moving averages and building momentum toward the $4,100 round number. While the oversold RSI warrants caution, the absence of a bullish catalyst suggests that any bounce will likely be sold aggressively.
The most important level remains $4,100: a clean break below it could accelerate losses into the $4,080–$4,023 region. Use tight risk controls and let the trend do the heavy lifting. For those who want to exploit these moves without emotional interference, our automated Gold trading bot is designed to identify and execute such high-conviction setups around the clock.
Trading Gold (XAU/USD) involves significant risk of loss. This content is for informational purposes only and does not constitute financial advice. Always conduct your own research and trade responsibly.