Gold is steady above $4,585 during the European morning on Thursday, recovering from intraday lows as traders weigh conflicting technical signals and prepare for high-impact US data. The Gold price today April 30 2026 Europe sits near $4,598, caught between short-term bullish momentum and a broader bearish trend. With the Advance GDP, Core PCE, and Employment Cost Index due in just a few hours, volatility is expected to pick up sharply. This session offers both opportunity and risk, and those looking to automate their entries can rely on our AI Trading Bot to execute precision trades around key levels.
Gold Market Overview
Market sentiment remains cautious this Thursday. The US Dollar continues to find support from a hawkish Federal Reserve and the repricing of rate-cut expectations. Morgan Stanley officially scrapped its call for Fed rate cuts this year, adding to the greenback’s strength. Despite the dollar's resilience, gold is clinging to gains above $4,550, supported by central bank buying that hit 244 tons in Q1 — the fastest pace in over a year. The mixed macro backdrop keeps XAUUSD in a tight range, with traders awaiting the 12:30 GMT data dump.
Technical Analysis
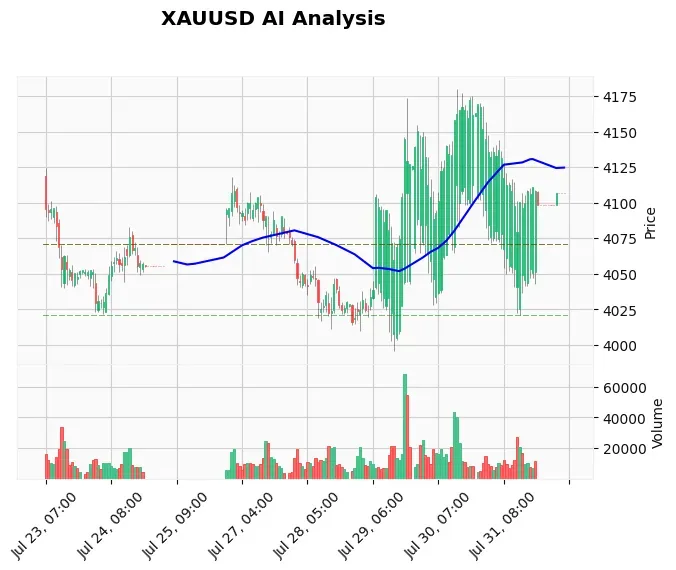
The latest 60-minute chart data shows gold trading at $4,598.38 with a high of $4,605.54 and a low of $4,585.11. The EMA structure is mildly bullish in the short run: price sits above the 20 EMA ($4,566.66) and the 50 EMA ($4,587.61), but remains well below the 200 EMA ($4,671.14), confirming the longer-term downtrend. The RSI at 59.58 indicates neutral-to-slightly-bullish momentum, not yet overbought. The MACD line (-1.06) has crossed above the signal line (-7.76), a bullish crossover that suggests short-term buying pressure could continue.
Immediate resistance is the psychological $4,600 level, followed by $4,620 and the weekly high near $4,655. On the downside, initial support is the $4,585 low, then the $4,550 zone which has acted as a pivot this week. The ATR of 20.25 points to average daily moves of around $20, so a break of either side could trigger a rapid move.
Fundamental Drivers
Today’s US calendar is heavy. Advance GDP for Q1 is expected at 2.2% (prior 1.4%), Core PCE m/m at 0.3% (prior 0.4%), and Employment Cost Index q/q at 0.8% (prior 0.7%). All three leaning hawkish would boost the dollar and pressure gold. However, markets may have already priced in some of this, and a miss could spark a sharp rally in gold. Additionally, geopolitical tensions related to Iran and trade tariff uncertainty continue to provide a safe-haven bid. For traders who prefer to capture volatility around such events, the News Trading Bot automates executions based on real-time news flow.
Devil's Advocate
Not every bounce holds. If the US data comes in strong across the board, the dollar could surge and push gold below $4,550. A break of the $4,550 support would expose the $4,500 psychological level and possibly lead to a test of $4,450. Additionally, the daily trend remains bearish, and today’s short-term rally could simply be a pullback before another leg lower. Traders should be prepared for a false breakout above $4,600.
Trading Strategy for This Session
Given the conflicting signals, a cautious approach is warranted. For those looking to trade the range, a buy-on-dip strategy near $4,575–$4,585 with a stop at $4,555 and a target at $4,600–$4,615 offers a favorable risk-reward. Alternatively, if price reaches $4,605 and shows rejection (e.g., bearish candlestick pattern), a short trade back to $4,570 could be considered. The ideal entry should wait for the data release to avoid whipsaw. For automated precision, consider the Price Action Pro EA, which identifies supply and demand zones on the fly and executes with discipline.
Risk Management
With ATR around $20, position sizing must account for potential stop-loss distances of $15–$25. Risk no more than 1–2% of capital on any single trade. If stopped out, step aside until volatility settles after the US data. Overtrading in this environment is a common pitfall; patience is the edge.
Frequently Asked Questions
Why is gold holding above $4,585 today?
Gold is finding support from a combination of short-term technical buying (MACD crossover) and safe-haven demand amid geopolitical uncertainty. Additionally, central banks remain aggressive buyers, providing a floor beneath prices.
What are the key gold levels for today's European session?
The immediate resistance is $4,600, followed by $4,620. On the downside, support is at $4,585 (session low), $4,550, and $4,500. A break above $4,620 could open the way to $4,655; a break below $4,550 targets $4,500.
How will the US GDP and PCE data affect gold?
Stronger-than-expected GDP and Core PCE would reinforce hawkish Fed expectations, strengthening the USD and pressuring gold. Conversely, weaker data could reignite rate-cut hopes and send gold back toward $4,650. The Employment Cost Index is also critical for wage inflation signals.
Should I buy or sell gold right now?
Given the mixed technical picture and pending high-impact news, it's prudent to wait for the US data releases. Scalpers can trade the $4,585–$4,605 range with tight stops, but swing traders should stay on the sidelines until direction clears. The AI Trading Bot can help manage entries without emotional bias.
Conclusion
Gold is at a crossroads today. The European session holds above $4,585, but the $4,600 resistance is the line in the sand. With major US data on the horizon, the next few hours will determine whether bulls regain control or bears resume the downtrend. The most important level to watch is $4,600; a clean break could trigger momentum buying, while a rejection would likely send gold back toward $4,550. For traders who want to trade this setup automatically with strict risk controls, our AI Trading Bot offers a proven 83% win rate on XAUUSD and runs 24/7, so you never miss a move.
Trading Gold (XAU/USD) involves significant risk of loss. This content is for informational purposes only and does not constitute financial advice. Always conduct your own research and trade responsibly.