Gold Price Today April 07 2026 Europe: Consolidation Holds at $4,645
The Gold price today April 07 2026 Europe shows a market caught in a waiting game, trading at $4,645 as the European session gets underway. Price action is compressed between the 20-period EMA at $4,654 and the 50-period EMA at $4,658, reflecting a classic pre-catalyst standoff. The dominant macro narratives—geopolitical tension from Trump's Iran deadline and anticipation of upcoming U.S. inflation data—are pulling in opposite directions, creating this tight, indecisive range. For traders, this is a patience-testing environment where the next directional move will likely be explosive. Want to trade this compressed setup with precision? Our AI Trading Bot specializes in identifying breakouts from such consolidations on XAU/USD, executing 24/7 with an 83% win rate.
Gold Market Overview: A Tense Pause
European traders are entering a market defined by conflicting impulses. On one hand, geopolitical risk premiums related to the Trump administration's deadline on Iran negotiations are providing a solid floor for gold, preventing any sharp selloff. On the other, this same uncertainty is bolstering the U.S. dollar's safe-haven appeal, which in turn caps gold's upside. The DXY is firm, and this conflicting dynamic has trapped XAU/USD in a roughly $20 range from the Asian session low of $4,636 to the high of $4,656. Sentiment is neutral-to-cautious, with volume subdued as major players hold fire ahead of the more consequential American session and the week's key data docket. The overall posture is defensive, favoring range-bound strategies until a clearer catalyst emerges.
Technical Analysis: Stuck Between Key Moving Averages
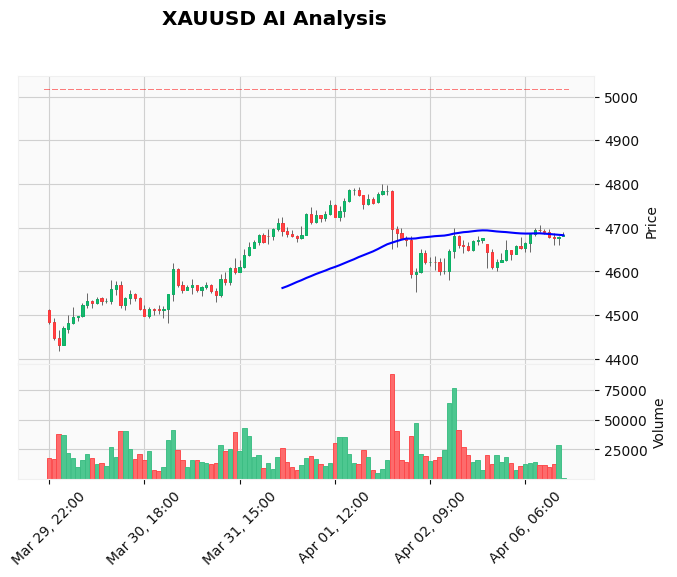
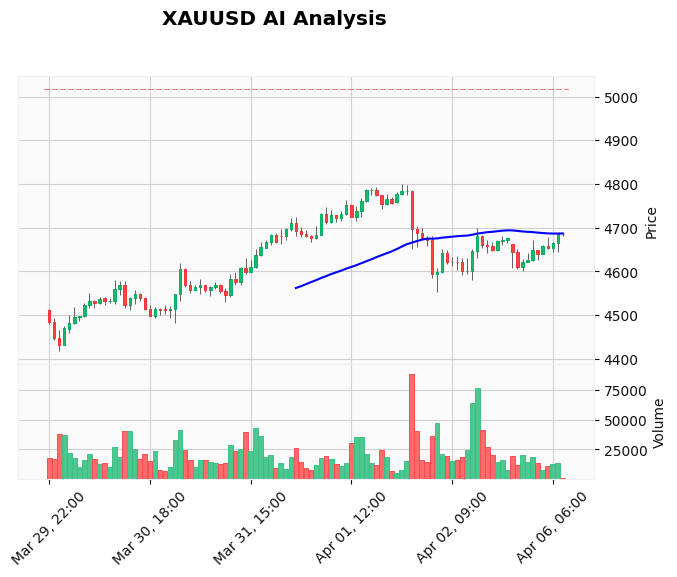
The technical picture for the Gold price today April 07 2026 Europe is one of compression. The price at $4,645 is sandwiched between the 20 EMA ($4,654.91) overhead and the 50 EMA ($4,658.27) just above it, while sitting comfortably above the longer-term 200 EMA at $4,633.30. This EMA sandwich indicates a short-term bearish bias (price below 20 & 50 EMA) within a longer-term bullish structure (price above 200 EMA). The RSI at 46.05 is dead neutral, offering no momentum clues. The MACD histogram is negative at -4.58 but its signal line is converging upward at -3.66, suggesting bearish momentum may be waning. The critical near-term levels are clear: resistance is clustered around $4,680 (yesterday's high and psychological level), while support rests at $4,600. A break above $4,656 (today's high) could target $4,680, while a failure below $4,636 opens the path toward the $4,600 support zone. Our Price Action Pro EA is engineered to spot the first genuine break of such compressed ranges, making it an ideal tool for this environment.
Fundamental Drivers: Geopolitics Versus Data
The fundamental landscape is a tug-of-war. The immediate headline driver is the looming deadline set by the Trump administration regarding Iran, a geopolitical wildcard that traditionally fuels gold's safe-haven bids. However, this is being counterbalanced by a resilient U.S. dollar, which is finding its own haven bids from the same source of uncertainty. Looking beyond the headlines, the market's primary focus is shifting to the upcoming U.S. economic data slate, including Core PCE and GDP figures later in the week. These releases will refine expectations for Federal Reserve policy, which remains the ultimate driver for gold's medium-term trajectory. The current holding pattern suggests the market has priced in a baseline of tension but is reserving judgment for concrete data. For traders looking to capitalize on the inevitable volatility from these events, our News Trading Bot automatically positions for high-impact data releases, removing the emotion from news-driven spikes.
Devil's Advocate: The Case for a False Break
While the consolidation suggests an impending breakout, the most likely initial move could be a false one. Given the low volatility (ATR of 24.21) and neutral positioning, the first test of either $4,680 resistance or $4,600 support could be met with aggressive counter-trading, squeezing out early breakout bets before the real move begins. Furthermore, if the Iran situation sees a de-escalation headline, it could trigger a simultaneous drop in gold and the DXY, leading to a confusing, whipsaw price action that traps both bulls and bears. The key level that would invalidate the current neutral-to-bearish short-term bias would be a sustained hourly close above the 50 EMA at $4,658, which would signal the compression is resolving upward.
Trading Strategy for This Session
Given the compressed range and high impending event risk, the optimal strategy for the European session is a cautious, range-bound approach. Aggressive breakout chasing is ill-advised. Instead, consider fading the extremes of the current range. A sell limit order near $4,655-4,658 (20-50 EMA confluence) with a stop loss above $4,665 and a take profit target at $4,625 offers a favorable risk-reward for a re-test of the session low. Conversely, a buy limit near $4,635-4,640 (above the Asian low) with a stop below $4,625 and a target of $4,655 provides a counter-trend bounce play. For traders who prefer not to babysit these levels, our Cloud Copy Trading platform allows you to passively mirror the trades of professionals who specialize in these precise, range-based Gold setups.
Risk Management in a Choppy Market
Choppy, consolidating markets are where discipline matters most. Position sizing should be reduced by at least 25% compared to a trending market setup, as false breakouts are more probable. A minimum 1:1.5 risk-reward ratio is essential to be profitable over a series of such trades. Most importantly, if a trade moves to breakeven, consider moving the stop loss to lock it in. The goal here is not a home run but consistent, small gains while preserving capital for the larger directional move that will follow later in the week. Never add to a losing position in this environment.
Frequently Asked Questions (FAQ)
Q: Why is the gold price stuck today?
A: The Gold price today April 07 2026 Europe is stuck primarily due to conflicting fundamental forces. Geopolitical tension provides support, but a stronger U.S. dollar (also boosted by haven flows) caps the upside. This has created a tight range between $4,636 and $4,656 as traders await clearer catalysts from U.S. data or geopolitical developments.
Q: What is the key support level for gold right now?
A: The most immediate support is at the Asian session low of $4,636. A break below that opens the path toward the more significant support zone around $4,600, which aligns with the 200-period EMA and a key psychological level where buy-side liquidity likely resides.
Q: Should I buy or sell gold in Europe today?
A> Given the neutral technicals and high upcoming event risk, neither a strong buy nor sell bias is justified for a directional hold. The better approach is to trade the range—selling near resistance ($4,655-4,658) and buying near support ($4,635-4,640)—with tight stop losses.
Q: How will Trump's Iran deadline affect gold?
A> It creates asymmetric risk. Any escalation or missed deadline could trigger a sharp gold rally on safe-haven demand. Conversely, a diplomatic breakthrough or extension could remove the geopolitical premium, leading to a swift drop. The uncertainty itself is causing the current consolidation.
Conclusion
The European session presents a classic consolidation phase for gold, with price compressed between key moving averages at $4,645. The battle between geopolitical risk and dollar strength has created a stalemate, making the $4,600 to $4,680 range the key battleground. Traders should prioritize patience and precision over aggression, focusing on range-fading strategies or waiting for a confirmed breakout with volume. The coming American sessions and data releases will be the true arbiters of direction. For traders seeking to capitalize on the eventual breakout without the stress of timing it manually, our best-selling Gold trading bot provides a systematic, emotion-free solution, monitoring XAU/USD 24/7 for high-probability entry signals.
Risk Disclaimer: Trading Gold (XAU/USD) involves significant risk of loss. This content is for informational purposes only and does not constitute financial advice. Always conduct your own research and trade responsibly.