Gold Price June 18 2026 New York Session: Is $4,270 the Line in the Sand?
The gold price June 18 2026 New York session opens with the yellow metal holding just below the critical $4,270 level, following a hawkish Federal Reserve that sent the Dollar to its highest since May 2025. XAU/USD currently trades around $4,257, nursing a 0.2% loss after yesterday's FOMC-triggered sell-off pushed prices toward the weekly low near $4,220. This level was defended overnight and aligns with the 20 EMA on the 4-hour chart, making it the pivot for today's price action. Today's quiet US data calendar leaves the macro narrative firmly in the hands of rate-hike expectations, keeping the short momentum intact. While a temporary bounce cannot be ruled out, any move toward $4,270 is likely to attract fresh sellers. Our AI Trading Bot is already primed for this setup, executing precise entries without emotion.
Gold Market Overview
Gold's bearish momentum is overwhelming. The Dollar Index (DXY) surged to 99.20—its strongest level in over a year—after the Fed's dot plot shifted toward additional rate hikes. Chair Warsh's refusal to provide forward guidance underscores a tightening bias that erodes the appeal of non-yielding gold. Adding to the downside pressure, the unexpected US-Iran peace deal and the reopening of the Strait of Hormuz have drained safe-haven demand. While silver manages a modest bounce above $68, its advance is capped by the same dollar strength. With no major US economic data today, today's narrative remains a one-way street for gold: lower highs and lower lows.
Technical Analysis
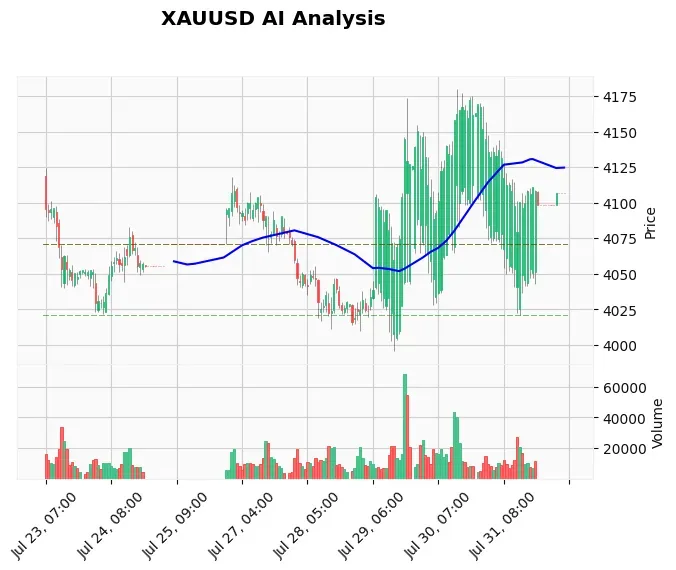
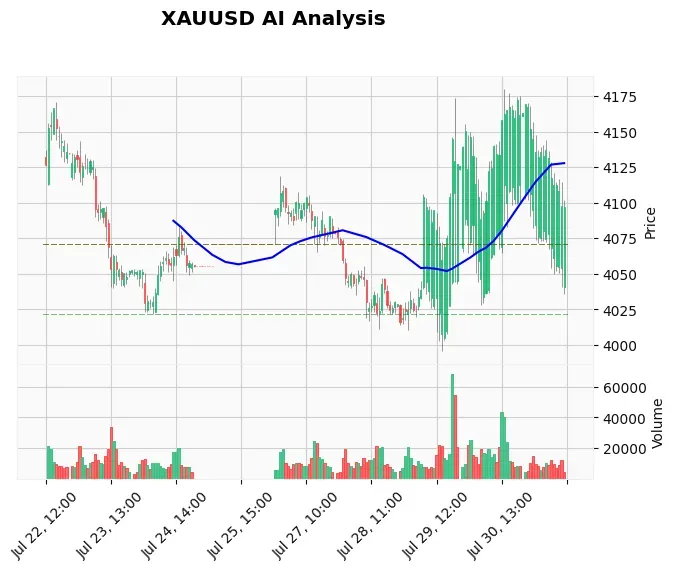
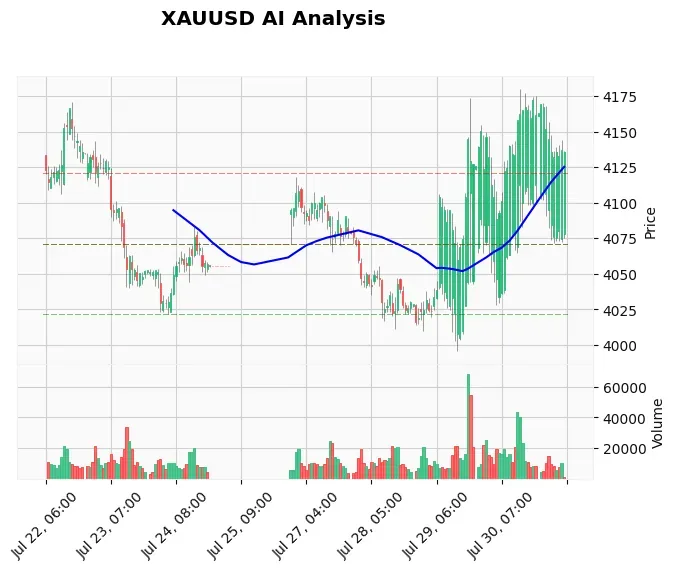
The H1 chart tells a clear story of bearish control. XAU/USD is trading below all key moving averages: the 20-period EMA at $4,285.08, the 50 EMA at $4,300.80, and the 200 EMA at $4,305.11. This moving average stack acts as a heavy resistance ceiling. The RSI (14) sits at 38.98, showing bearish momentum without being oversold, leaving room for further declines. MACD lines remain deep in negative territory (-17.97 vs signal -13.21), confirming accelerating selling pressure. The ATR of 23.24 indicates volatility remains elevated, meaning swift moves are probable. A bearish flag pattern on the 15-minute chart suggests continuation to the downside after brief consolidation. Immediate support holds at $4,268.53 (S2 from TradingView), but a break below that exposes the weekly low of $4,220, a level highlighted by our AI log as the next downside magnet. On the upside, any intraday recovery will face stiff headwinds at $4,270 (our pending sell limit zone), followed by the 20 EMA at $4,285. A close above $4,305 would be required to invalidate the bearish structure. With the chart available, the visual confirmation of lower highs since the $4,307 peak lands firmly on bears' side.
Fundamental Drivers
The hawkish FOMC outcome remains the dominant driver. The Fed kept rates unchanged but released a dot plot signaling more hikes than previously expected, causing a repricing of rate expectations. The US Dollar Index hit its highest since May 2025, making dollar-denominated gold costlier. Meanwhile, the US-Iran peace deal dramatically reduces the geopolitical risk premium that had supported gold earlier this month. US 10-year Treasury yields climbed to 3.85%, adding further fuel to the Dollar rally. With no high-impact US events scheduled today, the fundamental bias stays unambiguously bearish. Traders will watch for any Fed-related comments or geopolitical headlines that could spark short-term volatility. For traders who want to capitalize on high-impact news events, our News Trading Bot automates gold trades during key announcements.
Devil's Advocate
A bullish counter-scenario would require a catalyst strong enough to push XAUUSD back above $4,305—namely a sudden risk-off event, a dovish leak from the Fed, or an unexpected drop in the Dollar. Without such surprises, the technical barrier at $4,270 and the cluster of EMAs above act as formidable resistance. The only realistic invalidation of the bearish bias would be an hourly close above $4,305, which would open the door toward $4,330. If the weekly low holds, gold could enter a range between $4,220 and $4,270, providing range-trading opportunities. Given the macro backdrop, that scenario carries extremely low probability, and any break of $4,305 would likely be met with re-shorting at higher levels.
Trading Strategy for This Session
Our AI-driven analysis suggests waiting for a push higher to enter shorts. The ideal setup is a sell limit at $4,270—a level that perfectly aligns with intraday resistance and the prior breakdown point. A stop loss should be placed at $4,305, just above the recent swing high and the 200 EMA, giving the trade room to breathe while protecting capital if the bearish structure fails. The take profit target is the weekly low at $4,220, offering a favorable risk-reward ratio of approximately 1:1.5. A safer approach is to wait for a clear rejection at $4,270, such as a bearish engulfing candle on the 15-minute chart, before committing capital. For traders unable to monitor the chart, our Price Action Pro EA can automatically execute this smart-money concept on VPS, ensuring no opportunity is missed. If price breaks below $4,244 before touching $4,270, a short entry with a tight stop above $4,260 could also be considered, but that's a more aggressive play.
Risk Management
With an ATR of 23.24, gold could easily whip $20 in a single candle. Position size should be adjusted so that the 35-point stop (from $4,270 to $4,305) represents no more than 1-2% of account equity. The risk-to-reward stands at roughly 1:1.5, meaning the potential profit of $50 per ounce outweighs the risk. Do not widen the stop beyond $4,305 even during volatile spikes; getting stopped out is part of trading. Stick to the plan. Consider placing the sell limit order now and let the market come to you; chasing a breakdown could lead to poor entries. Using a low-latency MT4 VPS ensures your bot stays connected 24/7.
Frequently Asked Questions
Why is gold falling today?
Gold is under pressure because the US Dollar surged to a one-year high after the Fed signaled more rate hikes. This makes holding gold less attractive. The US-Iran peace deal also erased safe-haven demand.
What is the key support level for gold on June 18?
Immediate support is $4,268.53, but the more significant floor is the weekly low at $4,220. A break below $4,220 could accelerate losses toward $4,200.
How can I trade the New York session gold price today?
A high-probability setup is waiting for a rally toward $4,270 to sell, with a stop at $4,305 and a target at $4,220. An automated bot can manage this strategy for you.
What would invalidate the bearish gold outlook?
A strong hourly close above $4,305 would signal that bears have lost control and could trigger a short squeeze. However, that scenario needs a significant fundamental shift.
Conclusion
Gold price June 18 2026 New York session remains trapped under the weight of a hawkish Fed and a strengthening Dollar. As long as XAUUSD stays below the $4,270-4,305 resistance zone, the path of least resistance is down. The weekly low at $4,220 is the next major target, and a break below that would confirm a new bearish wave. With the Dollar showing no signs of weakness, the bias remains firmly bearish. Trading with a clear plan—using defined entries, stops, and targets—is the only way to navigate this volatile environment. For traders seeking consistent results without staring at screens all day, our best-selling Gold trading bot runs 24/7 on XAU/USD with an 83%+ win rate, executing precisely the types of setups we've discussed today.
Trading Gold (XAU/USD) involves significant risk of loss. This content is for informational purposes only and does not constitute financial advice. Always conduct your own research and trade responsibly.