Gold Price April 06 2026 New York Session: Retreats from $4,700 as Trump Speech Looms
The Gold price April 06 2026 New York session opens with a clear technical signal: a sharp rejection from the psychological $4,700 barrier. After an aggressive surge, XAU/USD has turned lower, trading around $4,680, as traders book profits and reduce risk ahead of a high-impact, unpredictable catalyst—a major Trump speech in just a few hours. This creates a classic "bull trap" or failed breakout pattern on the hourly chart, favoring a short-term pullback toward the $4,665-70 support confluence. The primary question for New York traders is whether this dip will be a buying opportunity in the broader bullish trend or the start of a deeper correction. Want to navigate this volatility automatically? Our AI Trading Bot is designed to execute high-probability Gold setups 24/7, filtering out the news noise.
Gold Market Overview: Holding Pattern Before the Storm
Market sentiment is cautiously defensive as the American session begins. The earlier modest gains, fueled by a softer US Dollar amid US-Iran ceasefire talks, have been entirely erased by the technical rejection at $4,700. The DXY is finding minor bids, adding pressure to dollar-denominated Gold. The macro theme has abruptly shifted from steady drift to event-risk preparedness. All other fundamental data points—including later FOMC Minutes and PCE prints—are secondary to the imminent political rhetoric. Traders are squaring positions, leading to thinner liquidity and the potential for exaggerated moves once the speech begins. The market's posture is not bearish on Gold but is prudently reducing exposure to an unknown binary outcome.
Technical Analysis: The Failed Breakout and Pullback Setup
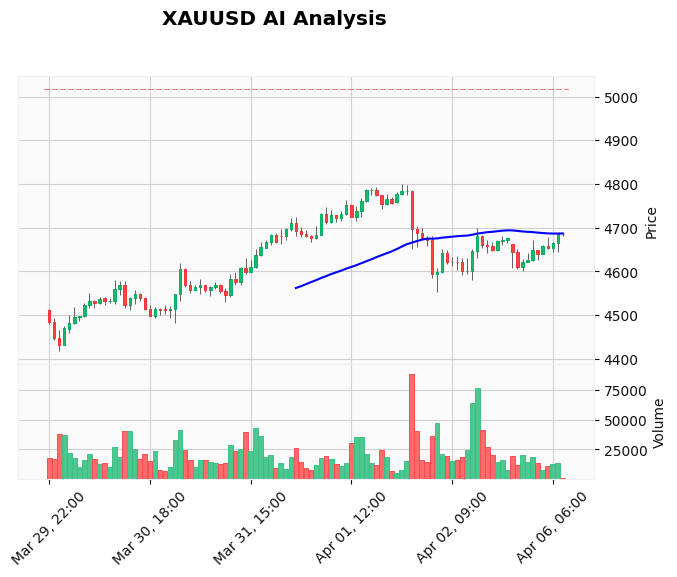
The hourly chart tells the story. XAU/USD made a direct assault on the $4,700 round number, printed a high of $4,681.66, and was swiftly rejected. This price action, occurring with an overbought hourly RSI (now curling down from above 70), is a high-probability reversal signal for the near term. The immediate support zone is critical: between $4,665 and $4,670. This area represents the prior breakout level and coincides with the rising 20-period Exponential Moving Average (EMA) at $4,668.54. A firm break and close below $4,665 would open the path toward a deeper pullback to $4,640, where a larger hourly structure low and a rising trendline confluence await.
On the broader timeframe, the trend remains firmly bullish. Price trades well above the daily EMA 50 ($4,662.98) and EMA 200 ($4,629.40). The MACD on our data feed is positive at 5.47, well above its signal line. However, the Average True Range (ATR) of 29.13 signals that volatile swings are the norm. Resistance is now clearly defined at $4,700, with the next major hurdle at the recent swing high near $4,715. The key for bulls is to defend the $4,665-70 zone to keep the short-term uptrend structure intact.
Fundamental Drivers: The Trump Speech Overrides Everything
One event dominates the fundamental landscape for the Gold price April 06 2026 New York session: the upcoming Trump speech. Markets are bracing for potential volatility across all assets, with Gold caught in a unique crosscurrent. As a geopolitical hedge, aggressive or hawkish rhetoric regarding Iran or trade could spark a safe-haven rally in Gold. Conversely, a tone perceived as dovish or de-escalatory could pressure Gold as risk appetite improves and the USD strengthens. This asymmetry makes pre-positioning exceptionally risky. The recent news flow of Iran ceasefire talks has already shown Gold's sensitivity to Middle East headlines. For traders who thrive on these events, our News Trading Bot is engineered to parse headlines and execute trades within milliseconds, turning market chaos into opportunity.
Devil's Advocate: What If the Pullback Deepens?
The bullish daily trend is undeniable, but the immediate risk is a more significant correction. If the Trump speech strikes a unexpectedly conciliatory tone on geopolitical fronts and the USD rallies strongly, the technical failure at $4,700 could attract follow-through selling. A break below the $4,665-70 support cluster would invalidate the immediate bullish structure and likely trigger stops toward the $4,650 area, and potentially down to the $4,640 confluence. Such a move, while likely a buy-in zone for longer-term bulls, would force many short-term longs to exit. The key reversal level to watch for a bearish shift is a sustained break below $4,640 on an hourly closing basis.
Trading Strategy for the New York Session
Given the high event risk, the prudent strategy is patience. The ideal scenario for bulls aligned with the daily trend is a pullback to the $4,665-70 support zone that holds firm, especially after the Trump speech clarifies the market's direction. A bullish reaction from this zone, with a reversal candlestick pattern, could offer a long entry.
- Entry Zone: $4,665 - $4,672 (post-speech reaction)
- Stop Loss: Below $4,660 (or below $4,640 for a wider swing trade)
- Take Profit Targets: TP1 at $4,690, TP2 at $4,700 (re-test), TP3 at $4,715.
For traders who prefer not to stare at screens during high volatility, a fully automated approach can manage these levels precisely. Consider using our Price Action Pro EA, which identifies and trades these SMC-based support and resistance setups on XAU/USD automatically.
Risk Management: Navigating Event Volatility
Position sizing is paramount today. With the ATR indicating nearly $30 average daily moves, and an event that could exceed that, risk per trade should be reduced—perhaps to half of your usual amount. A 1:2 or better risk-reward ratio is essential to justify the uncertainty. If a trade is triggered and quickly moves to a small profit before the speech, consider moving your stop to breakeven to eliminate risk. If the initial trade fails and your stop is hit, do not re-enter immediately. Wait for the market to absorb the news and establish a new, clearer structure. Discipline in sitting out unclear markets is a skill in itself.
Frequently Asked Questions (FAQ)
Q: Why is Gold dropping today?
A: Gold is pulling back primarily due to a technical rejection at the key $4,700 resistance level. Traders are also taking profits and reducing risk exposure ahead of a major, unpredictable Trump speech, which is causing a classic "risk-off" move in positioning ahead of the event.
Q: What is the most important level for Gold right now?
A: The most critical immediate level is the support zone between $4,665 and $4,670. If this area holds after the Trump speech, it could launch the next leg higher. If it breaks, a deeper pullback toward $4,640 becomes likely.
Q: How will the Trump speech affect Gold price?
A: The impact is asymmetric. Aggressive, hawkish, or conflict-focused rhetoric could boost Gold as a safe-haven. A calm, de-escalatory, or dovish tone could pressure Gold by boosting the USD and risk appetite. The volatility is guaranteed; the direction is not.
Q: Should I buy Gold on this dip?
A: If you are bullish on the longer-term trend, the dip toward $4,665-70 could be a potential entry zone, but ONLY after observing the market's reaction to the Trump speech. Entering before the speech is a high-risk gamble. Always use a stop loss below the key support.
Conclusion
The Gold price April 06 2026 New York session is defined by a clash between a clear technical pullback signal and an overwhelming fundamental event risk. The rejection from $4,700 sets the stage for a test of crucial support near $4,665. While the daily trend remains upward, the immediate path will be dictated by the market's interpretation of the upcoming political headlines. The strategic play is to wait for the event to pass, observe where price finds acceptance, and then align with the broader trend from a defined technical level. For traders seeking to capitalize on these setups without the emotional stress, automation is key. Let our best-selling Gold trading bot execute the plan with precision, turning today's volatility into calculated opportunity.
Risk Disclaimer: Trading Gold (XAU/USD) involves significant risk of loss. This content is for informational purposes only and does not constitute financial advice. Always conduct your own research and trade responsibly.