The Gold price forecast May 05 2026 Asia open points to a critical test of support as bears push XAUUSD toward the psychological $4,500 area. After a sharp breakdown below $4,550 in the previous session, gold opens near $4,530 with momentum firmly in favor of sellers. The question for Asian traders is whether $4,510 will hold or break, potentially triggering a deeper slide toward $4,490 and beyond. If you want to trade these levels automatically, try our AI Trading Bot which executes Gold setups with precision around the clock.
Gold Market Overview
The Asian session kicks off with a defensive tone across precious metals. The US Dollar Index (DXY) continues to climb on safe-haven demand amid escalating US-Iran tensions in the Strait of Hormuz. Hawkish Fed comments from New York Fed President Williams—who trimmed GDP forecasts and raised inflation expectations—add further pressure on gold. The 10-year US Treasury yield is pushing higher, reducing the appeal of non-yielding assets. Sentiment is overwhelmingly bearish, and any bounce during the Asian session is likely to be limited by strong overhead resistance.
Technical Analysis
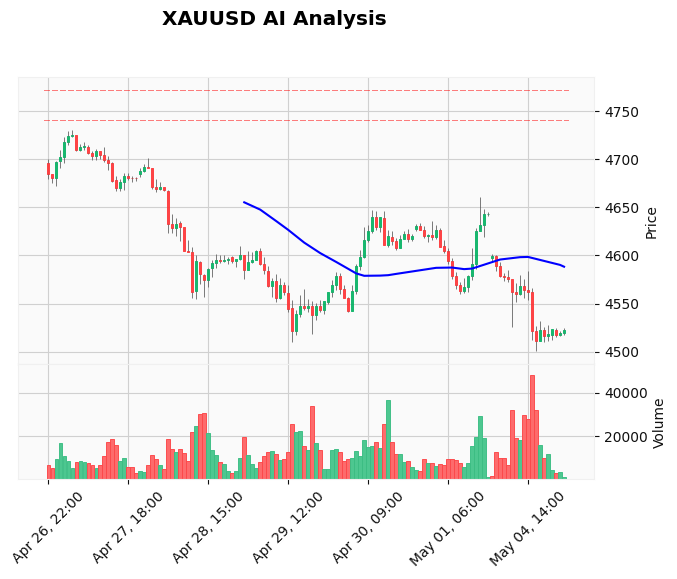
On the hourly chart, XAUUSD remains in a well-defined downtrend with lower highs and lower lows intact. The EMA structure is bearish: price is trading below the 20 EMA ($4,547), 50 EMA ($4,573), and 200 EMA ($4,633). The RSI at 37.63 shows bearish momentum without being oversold, leaving room for further downside. The MACD line (-21.46) is below the signal line (-20.14) with a widening negative histogram, confirming bearish pressure. ATR at 19.06 suggests volatility remains elevated, typical of breakout environments.
Key support from our Gold technical analysis tools lies at $4,510.31 (S1 from TradingView webhook data). A clean break below this level could accelerate selling toward $4,490 (TP1) and $4,460 (TP2). On the upside, immediate resistance is at $4,547 (20 EMA) and the prior breakdown zone $4,550-4,560. A recovery above $4,565 would invalidate the short-term bearish bias.
Fundamental Drivers
The primary catalyst behind gold’s slide remains the geopolitical risk premium flowing into the US dollar. Escalating tensions in the Middle East have pushed investors toward USD and Treasuries, while gold—traditionally a safe haven—is being sold as traders raise cash. Additionally, Fed’s Williams signaled that the central bank is well-positioned but warned that energy price surges could complicate inflation forecasts. Upcoming US economic data on Tuesday (ISM Services PMI and JOLTS) will be crucial; a stronger reading could fuel further USD gains and push gold toward $4,500. Trade these high-impact news events with the News Trading Bot designed to catch volatility.
Devil's Advocate
While the bearish case is strong, traders must consider reversal risks. The M15 chart shows surging momentum—a short-term counter-trend bounce is possible. If gold holds $4,510 and forms a bullish engulfing candle, a squeeze back toward $4,550 could trap late shorts. Additionally, any unexpected de-escalation in Iran tensions could trigger a sharp USD sell-off, lifting gold. The $4,500 level is psychologically significant and has historically attracted dip-buyers. Only a sustained break below $4,490 would confirm the bearish breakout.
Trading Strategy for This Session
Based on the confluence of bearish technicals and fundamentals, the preferred bias is short. However, given gold is near support, patience is required. Wait for a retest of resistance in the $4,540-4,550 zone to short with a stop loss above $4,565. Alternatively, a breakout trade below $4,510 can be triggered on a 15-minute close beneath that level. Targets: first at $4,490 (TP1), then $4,460 (TP2). Risk-reward ratio exceeds 1:2. For live trade execution, consider following our professional XAU/USD signals delivered directly to your MT4.
Risk Management
Position sizing is critical in this volatile environment. With ATR at $19, a 1% account risk suggests trading 0.5 lots per $10,000 account with a 1:1 risk-reward. If gold fails to break support and reverses, the short should be exited immediately. Always use stop-loss orders and avoid adding to losing positions. The Asian session can see false breaks, so confirm any breakout with volume and price action.
Frequently Asked Questions
Q: Why is gold falling today?
A: Gold is falling due to a strong US dollar rally driven by safe-haven demand from escalating US-Iran tensions and hawkish Fed rhetoric. Higher US yields also reduce gold's appeal as a non-yielding asset.
Q: What is the key support for gold on May 5, 2026?
A: The immediate support level is $4,510 from TradingView data. A break below could open the door to $4,490 and $4,460.
Q: Is it safe to buy gold at current levels?
A: Given the downtrend, buying is risky until a clear reversal pattern forms. The RSI is not oversold, and fundamentals remain bearish. Wait for a confirmed bounce above $4,550 before considering longs.
Q: What economic events should gold traders watch today?
A: The ISM Services PMI and JOLTS Job Openings data at 14:00 UTC will be key. A stronger-than-expected number could strengthen the dollar and push gold lower.
Conclusion
The Gold price forecast May 05 2026 Asia open is decisively bearish, with $4,510 acting as the line in the sand. Bears have the upper hand, but traders should watch for a potential squeeze before committing. The most important level today is the $4,510 support; a clean break could trigger the next leg down toward $4,490. Trade smart and let automation handle the execution. Check out the best-selling Gold trading bot to run your strategy non-stop.
Trading Gold (XAU/USD) involves significant risk of loss. This content is for informational purposes only and does not constitute financial advice. Always conduct your own research and trade responsibly.