Gold Price Forecast June 10 2026 Asia Open: Bears Eye $4,200 After US-Iran Flare-Up
Gold (XAU/USD) extends its aggressive sell-off into the Asian session on June 10, 2026, crashing below the psychologically important $4,250 barrier and touching a fresh two-month trough near $4,218. The immediate catalyst is a sharp escalation in US-Iran tensions after President Trump vowed retaliation for a helicopter strike, sending safe-haven flows into the US Dollar rather than gold. Adding to the bearish pressure is the proximity of high-impact US CPI data due in just over 11 hours, which keeps traders on edge. With price action confirming a series of lower lows and lower highs, the path of least resistance remains firmly to the downside, but oversold intraday conditions and the looming CPI release argue for patience. Get the exact entry triggers and automated execution for setups like this with our AI Trading Bot—it runs 24/7 on XAU/USD with an 83%+ win rate.
Gold Market Overview
The Asian open finds Gold at $4,218, down from Tuesday’s close of $4,222 and decisively below the prior session’s low of $4,235. The US Dollar Index (DXY) surges as geopolitical angst and hawkish Federal Reserve expectations combine to lure capital into the greenback. Typically, military tensions in the Middle East boost gold demand, but this time, the market treats the USD as the preferred safe haven, as gold’s non-yielding status becomes a liability amid rising real yields. Technically, the break below $4,250 invalidated a key support zone and opened the door to the $4,200 round number. With the Asian market relatively thin, volatility may exaggerate moves, but the broader sentiment is decisively bearish ahead of US CPI. If the core CPI print comes in softer than the 0.3% forecast, it might cap the USD’s advance later, but for now, the pair is under relentless selling pressure.
Technical Analysis
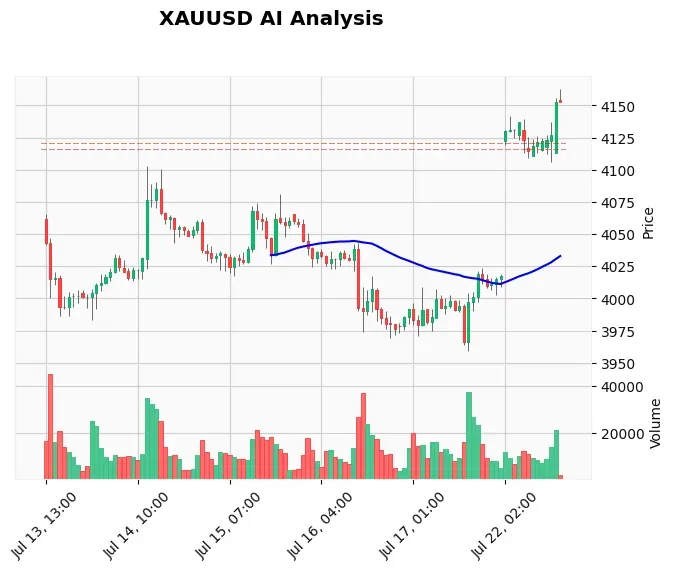
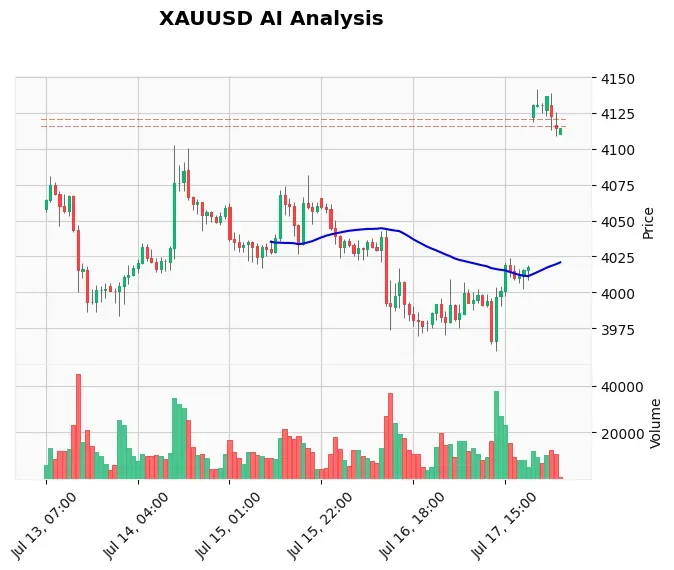
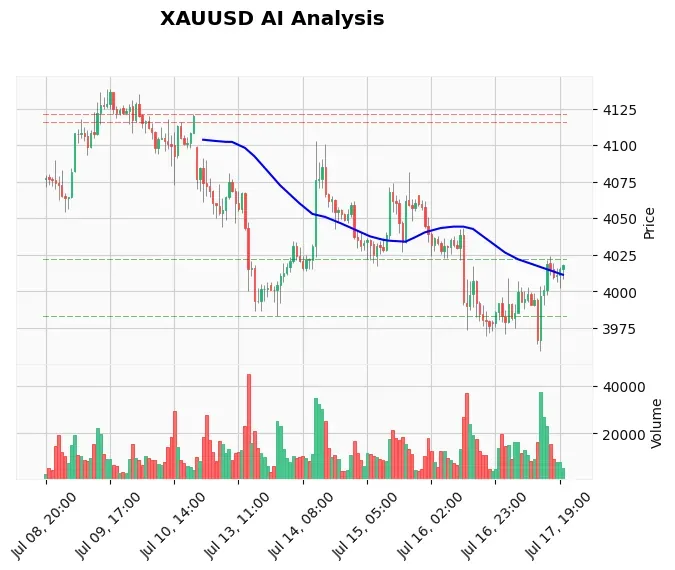
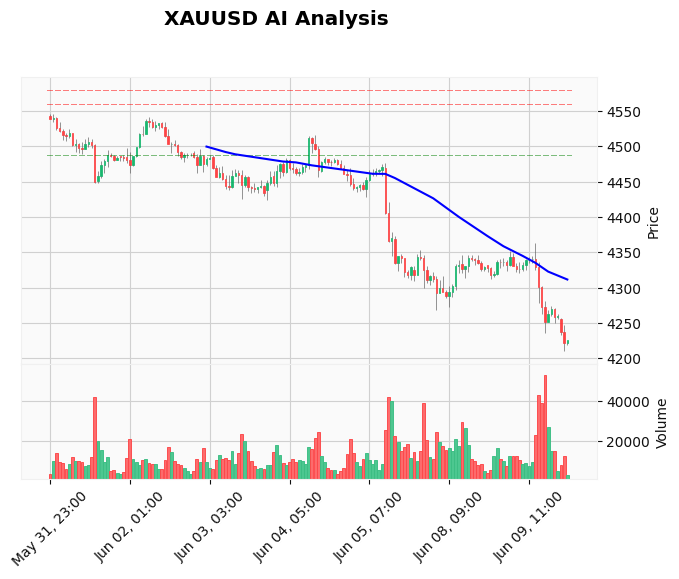
From a technical perspective, the daily trend remains deeply bearish. All three exponential moving averages—20-EMA at $4,280, 50-EMA at $4,318, and 200-EMA at $4,413—are sloping lower and stacked in bearish alignment (20 < 50 < 200). The H1 chart paints an even grimmer picture: the Relative Strength Index (RSI) has plunged to 22.69, signaling an oversold condition, yet no bullish divergence has emerged to suggest an imminent reversal. The MACD histogram is widening below the signal line, with current readings of -27.37 vs -18.89, confirming accelerating downside momentum. The Average True Range (ATR) at 22.91 indicates that daily swings of $20-$25 are normal, so a range expansion toward $4,180 is plausible. Key levels to watch: immediate support sits at the $4,200 psychological handle, followed by $4,180 (Monday’s low). A clean break below $4,200 would likely accelerate selling toward the $4,150 area. On the upside, former support at $4,240-$4,250 now acts as formidable resistance, with any recovery likely capped by the 20-EMA at $4,280.
Fundamental Drivers
Geopolitical headlines are dominating the early session. The US-Iran flare-up, with Trump vowing a strong response, has injected fresh uncertainty, but rather than gold, it is the USD that benefits. The dollar’s rally is further underpinned by expectations that the Federal Reserve will remain hawkish, especially if tomorrow’s CPI data reinforces the need for restrictive policy. Market forecasts for May CPI point to 0.3% m/m core and 0.5% m/m headline, slightly below previous readings. If the actual data surprises to the downside, it could later dent USD strength and provide a temporary reprieve for gold. For now, the fundamental backdrop, including a rising 10-year Treasury yield back above 4.5%, keeps XAU/USD under pressure. Traders should closely monitor any hints of de-escalation or a sharp dollar pullback. To automate your news-driven entries, consider our News Trading Bot, which capitalizes on high-impact events precisely like CPI.
Devil’s Advocate
The bearish thesis is compelling, but a counter-scenario deserves attention. If the US CPI prints materially softer than expected—especially the m/m figures—the dollar could correct swiftly, and gold might stage a sharp short-covering rally from oversold levels. A close above the $4,250 resistance would be the first sign of a trend reversal, invalidating the immediate downside bias. Additionally, any sudden cooling of US-Iran rhetoric could trigger a ‘risk-on’ move that temporarily lifts gold as the dollar eases. The key reversal zone to watch is $4,250; a sustained break above that level would force bears to cover and open the door to $4,280. Until then, the path of least resistance remains lower.
Trading Strategy for This Session
Given the oversold nature and the impending CPI release, our AI analysis suggests a WAIT stance—avoid chasing the breakdown now. The optimal strategy is to wait for either a shallow pullback to the $4,240-$4,250 resistance zone for a sell entry with a stop-loss above $4,265 (allowing for ATR-induced noise), targeting $4,200 and then $4,180. Alternatively, after the CPI print, if the pair breaks decisively below $4,200 with momentum, a post-news short with a tight stop above $4,220 could aim for an extended move to $4,150. For traders who prefer automated execution, our Price Action Pro EA uses smart money concepts to trade these key levels without emotion. Remain flat ahead of the news and let the data dictate the next move.
Risk Management
With an ATR of 22.91, stop-losses should be placed at least 1.5 times the ATR from the entry to avoid premature exits. For a sell at $4,240, a stop at $4,275 (35 points) is reasonable, targeting a 1:2+ risk-reward. Position size should be limited to 1-2% of account equity. Given the potential for whipsaw around CPI, it’s also wise to run your strategy on a Windows VPS for Gold trading to ensure connectivity and rapid execution. Never chase a trade without a confirmed trigger, and avoid holding through the news if your plan doesn’t account for slippage.
Frequently Asked Questions
Q: What is the gold price forecast for June 10 2026 Asia open?
A: Gold is trading severely bearish, probing the $4,200 level after breaking below $4,250. The forecast points to continued downside pressure with a potential test of $4,180 if $4,200 gives way. Resistance at $4,240-$4,250 caps any recovery.
Q: Why is gold falling despite geopolitical tensions?
A: Unlike past crises, the current US-Iran tensions are strengthening the US Dollar as the primary safe haven, not gold. Rising Treasury yields and hawkish Fed expectations amplify the dollar’s appeal, leaving gold under pressure. This shift reflects the market’s focus on yield differentials rather than pure risk aversion.
Q: What are the key support levels for XAUUSD today?
A: The immediate support is the $4,200 round number, followed by $4,180 (a lower low from Monday) and then $4,150. A sustained break below $4,200 would likely accelerate the sell-off toward these levels. Bulls need a recovery above $4,250 to change the near-term outlook.
Q: How will US CPI data affect gold prices?
A: A higher-than-expected CPI would likely boost the USD and push gold lower, potentially through $4,200. Conversely, a softer CPI could weaken the dollar, triggering a short-covering rally in gold towards $4,240-$4,250. Track the news impact with our News Trading Bot and stay prepared for volatility.
Conclusion
The $4,200 level is the line in the sand for XAU/USD this Asian session. A successful defense could prompt a bounce, but the overwhelming bearish sentiment—fueled by a strong dollar, hawkish Fed bets, and unique geopolitical flows—suggests that any upside will be limited and sold into. Traders should prepare for a volatile US CPI release later today and avoid aggressive positioning beforehand. Let our AI Trading Bot handle the grind; it’s built for volatility like this and comes with real-time alerts and automated execution. Stay disciplined, stick to the plan, and trade the levels, not the headlines.
Trading Gold (XAU/USD) involves significant risk of loss. This content is for informational purposes only and does not constitute financial advice. Always conduct your own research and trade responsibly.