Gold Price Forecast Jul 4-10, 2026: $4121 or $4220?
The final week of June closed with a burst of bullish energy for Gold, as a sharply weaker‑than‑expected US employment report torpedoed the Dollar and revived the metal’s safe‑haven appeal. XAU/USD ended the week clinging to the $4175 area, having bounced cleanly from the $4121 support zone – a level that now anchors the entire short‑term outlook. As we step into a holiday‑shortened trading week (US markets will be quiet on Monday in observance of Independence Day), the economic calendar is virtually empty of high‑impact releases, handing control of price action squarely to the charts. That makes the battle between $4121 support and $4220 resistance the defining theme for the next five sessions.
The absence of scheduled event risk doesn’t mean we can take our eyes off the fundamentals. Safe‑haven demand, fuelled by geopolitical tensions and stubborn inflation, remains the dominant narrative, and the fallout from last Friday’s NFP miss has dramatically twisted the interest‑rate outlook. For traders who want to stay ahead of these shifts without watching screens around the clock, our AI Trading Bot automatically monitors XAU/USD and executes trades with a proven 83%+ win rate – leaving you free to check in only when it matters.
Last Week in Review
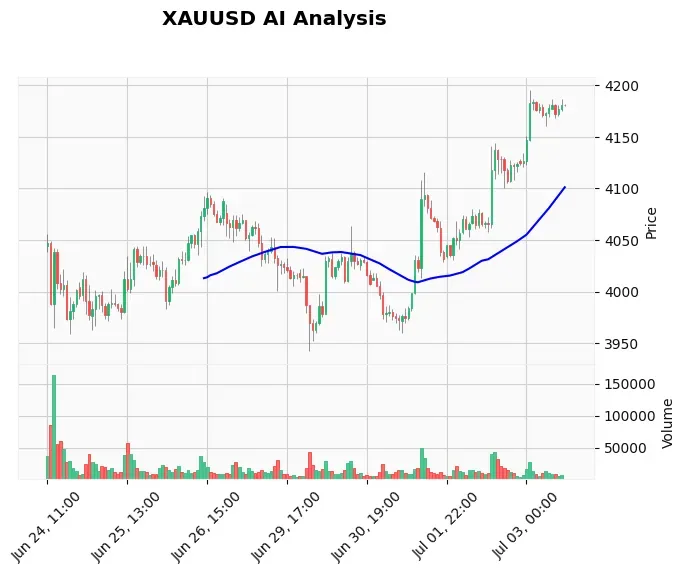
Although precise open and close data are unavailable due to a feed interruption, the price action spoke for itself. Gold carved out a clear low near $4121.58 – the first layer of visible support – before a powerful rally ignited by Friday’s Non‑Farm Payrolls print. The US economy added far fewer jobs than forecast, sending the Dollar Index tumbling and pushing XAU/USD through a series of intraday hurdles. The metal touched an area just below the $4220 resistance zone and settled near the psychologically important $4175 level.
The move was textbook: a classic ‘risk‑off’ trigger that validates the bullish fundamental overlay we have been tracking for weeks. Interestingly, the weekly RSI, though still below 50 at 40.73, carved a higher low – a subtle sign that bearish momentum may be exhausting. The 20‑week EMA at $4005 and 50‑week EMA at $4053 are far below current price, reinforcing that the broader uptrend remains intact despite the still‑neutral RSI reading.
Volume was elevated during the rally, confirming institutional participation. Short‑term traders who bought the NFP dip were rewarded handsomely, and the close above the widely followed 200‑day EMA at $4174 sets a bullish tone for the week ahead.
Weekly Technical Outlook
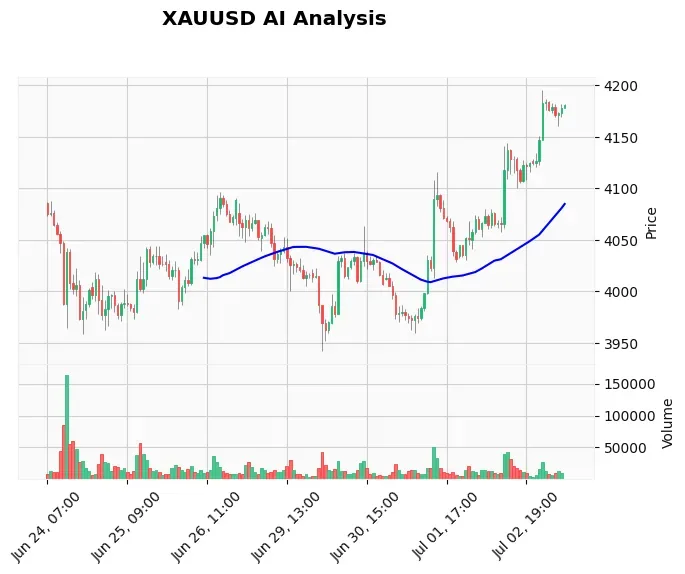
The daily chart, which feeds our TradingView‑powered webhook, paints a picture of a market transitioning from corrective mode back to trend. Price is currently hugging the 200‑day EMA at $4174, exactly where bulls need to see acceptance. Meanwhile, the 20‑day EMA at $4005 and 50‑day EMA at $4053 are lagging far behind – a configuration that often precedes a moving‑average crossover and a fresh leg higher.
The MACD histogram, while still printing negative bars (-22.48), has seen its signal line (-25.74) lift, indicating that momentum is shifting in favour of buyers. Even though the overall MACD reading remains below the zero line, the contraction of negative momentum is a classic prelude to a bullish crossover. Add the ATR (Average True Range) of $25.10, and we can expect a weekly trading range of roughly $125 – $150, assuming fairly normal conditions.
Two scenarios dominate the technical landscape:
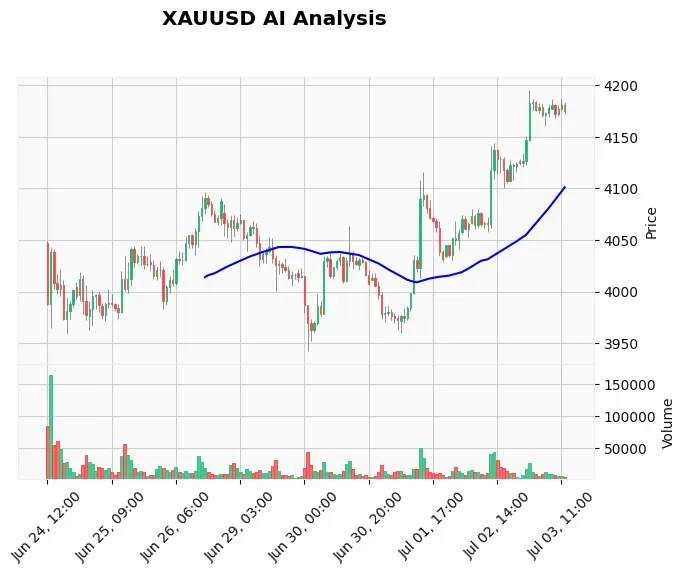
- Bullish scenario: A clean hold above $4121 support, followed by a decisive break of $4220.98 resistance, would target the secondary resistance zone at $4382.15. Given the empty calendar, a slow, grinding advance is more likely than a vertical spike. A weekly close above $4220 would invite momentum traders to push for the $4300 handle.
- Bearish scenario: A failure at $4121 – the level that held five times last week – would trigger a wave of stop‑loss orders and open the door to a rapid drop toward $4023.76. Such a move would almost certainly coincide with a sudden strengthening of the US Dollar, perhaps on the back of unexpected hawkish commentary.
The 4‑hour chart adds a further layer of nuance. According to our AI Analysis Log (July 3), the H1 EMA stack (20>50>200) confirms the higher‑timeframe bullish structure, but the short‑term RSI had dipped to 47.6 and the ADX signalled a brief bearish cross. This corrective dip likely already ran its course, and the quick rebound from the EMA50 at $4168 suggests dip‑buyers are firmly in control.
Fundamental Outlook
The overarching fundamental picture remains decidedly gold‑positive. The combination of softer US employment data, fading rate‑hike expectations, and persistent geopolitical risk creates an almost ideal environment for the metal. Last week’s NFP shock effectively removed the risk of a July rate increase, and markets are now pricing in a more than 50% chance of a cut by the September meeting. Lower real yields and a weaker Dollar are jet fuel for Gold.
The week ahead, however, is unusually light in terms of calendar risk. No high‑impact US economic releases are scheduled – a rare occurrence that reflects the Independence Day holiday and a quiet data pipeline. The most closely watched events, such as Fed minutes and jobless claims, will arrive later in the month. This means Gold will have to survive on the residual bullish sentiment and technical momentum. While that may seem fragile, history shows that quiet weeks can actually accelerate existing trends because there is no fresh negative news to derail the dominant narrative.
In the background, central‑bank buying remains a powerful undercurrent. China’s ongoing accumulation and talk of de‑dollarisation keep a safety net under any price dips. Also, the Yuan’s resilience against the Dollar, as noted by analysts at Societe Generale and UOB, adds another layer of support by reducing the Greenback’s universal appeal. Even though the calendar is blank, sudden geopolitical events – a missile test, a trade spat, a banking wobble – can still inject volatility. For those moments, our News Trading Bot is designed to identify and trade high‑impact headlines within seconds, turning chaos into opportunity.
Economic Calendar
| Date | Time (GMT) | Event | Impact |
|---|---|---|---|
| Jul 6-10 | - | No high‑impact USD events scheduled | - |
The only potential disturbance is the regular release of speeches by regional Fed presidents, none of whom are scheduled to make major policy announcements. Traders should still keep an eye on newswires for any surprise comments, but the baseline expectation is a quiet, thin‑liquidity environment – perfect for the trend to play out without interruption.
Gold Trading Strategy This Week
Given the bullish technical and fundamental setup, the week’s primary strategy is to buy dips. The ideal entry zone lies between $4140 and $4160, where the 1‑hour and 4‑hour moving averages converge and prior resistance turned support from last Friday’s close can be found. A prudent stop‑loss sits just below the invalidation level of $4120, keeping the initial risk to about $40 (or roughly two times the ATR). The first take‑profit target is the $4220 resistance zone, with an extended target of $4300 if momentum builds.
For those who prefer a more automated, rules‑based approach, the whole setup aligns perfectly with the logic used by our Price Action Pro EA. This bot scans institutional order flow on multiple timeframes, identifies liquidity grabs, and enters on break‑of‑structure – exactly the kind of pattern that emerges after a corrective dip like the one we just saw. Whether you execute manually or let the EA do the work, the principle is the same: respect the daily trend and never fight the central bank.
Day traders can look for intraday buy opportunities on any pullback to the 200‑day EMA near $4165, using a tight 10‑point stop below the hourly low. Swing traders, on the other hand, should give the trade more room and let the market work through the thin early‑week liquidity. In both cases, a trailing stop once the trade is 25 pips in profit will protect gains.
Risks to Watch
No forecast is complete without considering what could go wrong. The single biggest risk this week is a sudden hawkish turn from a Fed official. Although the consensus has shifted firmly into the dovish camp, a well‑placed comment hinting that a July hike is still possible could send the Dollar soaring and crush Gold below $4121. A break of that level would immediately shift the bias bearish and target the $4023 support, with stops‑runs likely accelerating the move.
Geopolitical de‑escalation – perhaps a surprise peace deal or cooling of tensions in Eastern Europe – could also remove safe‑haven premium, though such events tend to unfold over weeks, not days. Finally, the thin liquidity conditions themselves pose a risk; a small order can cause outsized moves, and stop‑hunting is common during holiday weeks. Robust position sizing and a reliable VPS ensure your trades stay live even when your terminal is off.
FAQ
Q1: What is the gold price forecast for the week of July 4-10?
A: The primary forecast calls for a bullish continuation as long as XAU/USD holds above the $4121 support. A break above $4220 would open the door to $4300 and potentially $4382. Failure at $4121, however, would flip the short‑term outlook bearish and target $4023.
Q2: Why did gold rally at the end of last week?
A: The rally was triggered by a deeply disappointing US Non‑Farm Payrolls report, which slashed the probability of further Federal Reserve rate hikes. The Dollar dropped sharply, and investors rushed into Gold as a safe haven and as a hedge against looser monetary policy.
Q3: What are the key support and resistance levels for XAUUSD now?
A: Key weekly support stands at $4121.58, with a deeper floor at $4023.76. On the upside, the immediate hurdle is $4220.98, followed by the solid resistance zone near $4382.15. The 200‑day EMA at $4174 is also a critical pivot.
Q4: How does the US holiday affect gold trading this week?
A: With US markets closed on Monday for Independence Day, trading volumes will be thinner than normal. This can lead to erratic price action and false breakouts, but it also means that the prevailing trend – currently bullish – may move more easily if genuine buying pressure emerges.
Q5: Is it a good time to buy gold this week?
A: Many traders view the current pullback to the $4140-$4160 area as an attractive entry for a swing long, provided a stop is placed below $4120. The risk‑reward ratio is favourable given the proximity of solid support and the absence of negative scheduled news.
Q6: What are the biggest risks for gold this week?
A: The largest risk is a surprise hawkish statement from a Federal Reserve policymaker that reignites rate‑hike fears. A break below $4121 would also turn the technical picture bearish. Geopolitical de‑escalation and thin liquidity‑driven whipsaws are secondary concerns.
Conclusion
The upcoming week hands Gold traders a rare gift: a bullish fundamental backdrop married to clear technical levels, with no scheduled high‑impact events to muddy the waters. As long as XAU/USD respects the $4121 support, the path of least resistance points higher, with the $4220 zone the first serious test. If that barrier gives way, the rally could rapidly extend into the $4300s, rewarding patient bulls.
In a market where seconds count and emotions cloud judgment, automation can be the difference between a missed opportunity and a booked profit. Our AI Trading Bot is engineered to identify and execute these exact setups – buying dips at logical supports and trailing stops to lock in gains – without hesitation or fatigue.
Remember: the quietest weeks often produce the cleanest trends. Stay disciplined, respect your stops, and let the market show you its hand.
Trading Gold (XAU/USD) involves significant risk of loss. This content is for informational purposes only and does not constitute financial advice. Always conduct your own research and trade responsibly.