Gold Price Forecast April 17 2026 Asia Open: $4,785 or $4,801 Breakout?
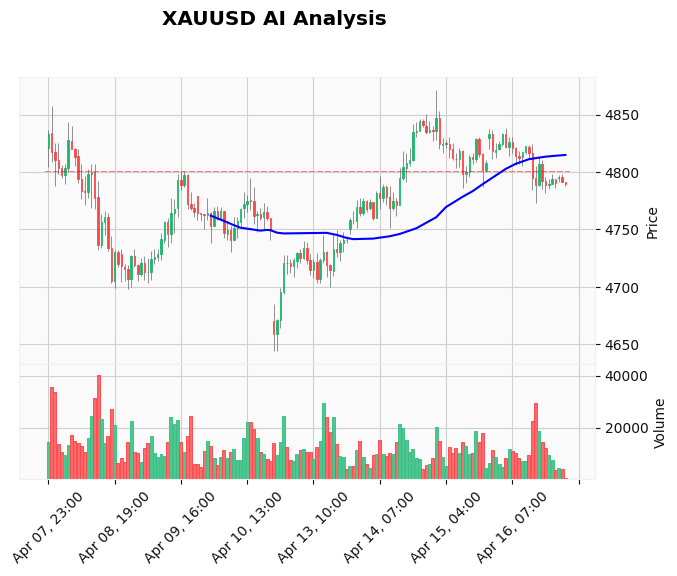
The Gold price forecast April 17 2026 Asia open paints a classic picture of a market at a crossroads. XAU/USD opens the Thursday session virtually unchanged, trading near $4,794 after spending the overnight hours trapped between $4,785 and $4,801. This tight, 16-point range is characteristic of the Asian liquidity void, where markets consolidate and prepare for the larger moves of the European and US sessions. The immediate question for traders is whether this is a bullish continuation pause or the calm before a deeper pullback. The technical structure offers a clear map: a break above $4,801 opens the path to $4,815, while a failure below $4,785 risks a test of the $4,770 zone. Want to trade this precise range-bound action automatically? Our AI Trading Bot is specifically programmed to identify and execute on these consolidation breakouts with an 83%+ win rate.
Gold Market Overview
Sentiment in the early Asian hours is neutral, caught between conflicting macro narratives. On one hand, headlines suggesting potential progress in US-Iran peace talks are easing the immediate geopolitical premium that has buoyed gold for weeks. This has capped the upside and allowed the US Dollar to find a modest bid, pressuring gold marginally. On the other hand, the underlying structural supports remain firmly in place. Persistent inflation fears, fueled by ongoing supply chain disruptions and the lingering effects of prior tariffs, continue to erode the appeal of fiat currencies. Furthermore, Federal Reserve officials, while cautious, have not abandoned the narrative of potential rate cuts later in the year. This combination creates a holding pattern where selling is limited by macro tailwinds, but buying lacks a fresh catalyst. The DXY is flat, and Treasury yields are steady, leaving gold to trade on its own technical merits for now.
Technical Analysis
The H1 chart reveals a market in a textbook consolidation phase. Price is currently sandwiched between the immediate dynamic resistance of the 20-period Exponential Moving Average (EMA) at $4,801.22 and the key static support cluster between $4,785 and $4,780. The 50-period EMA at $4,802.00 adds further confluence to the $4,801-4,802 resistance zone. A daily close above this area would signal a resumption of the broader bullish trend and target the next major resistance near $4,815. The Relative Strength Index (RSI) at 45.38 is neutral, reflecting the current lack of directional momentum. The MACD histogram is negative but the signal lines are converging, indicating bearish momentum may be waning. The Average True Range (ATR) of 15 points suggests we can expect a meaningful move once this range breaks. The primary support levels from our TradingView data are at $4,698 and $4,644, but the more relevant immediate floors are the session low at $4,785 and the prior consolidation high around $4,780.
Fundamental Drivers
The fundamental landscape is dominated by geopolitics and central bank policy expectations. The primary headwind for gold is the apparent de-escalation in Middle East tensions, with talks between the US and Iran in focus. This reduces the immediate safe-haven demand that drove gold to recent highs. However, this is countered by a more persistent bullish theme: inflation. Analysis confirms that past tariffs have contributed significantly to inflationary pressures, keeping real yields subdued and maintaining gold's appeal as an inflation hedge. Fed speakers are providing a mixed but generally non-hawkish message, with some still penciling in rate cuts for 2026. This environment creates a "wait-and-see" stance among institutional traders. For active trading around these shifting headlines, a News Trading Bot can provide a decisive edge by instantly parsing news flow and executing trades faster than any human.
Devil's Advocate
The bullish consolidation thesis hinges on the $4,785-4,780 support zone holding firm. The primary risk is a fundamental shift that invalidates this technical level. If Iran peace talks show concrete, positive progress, the geopolitical premium could unwind swiftly, triggering a wave of long liquidation. This could see gold break below $4,780 and target the $4,770 area initially. Furthermore, any surprise strength in upcoming US data could reinforce a "higher-for-longer" Fed narrative, boosting the dollar and real yields, which is typically negative for non-yielding gold. A break and sustained close below $4,780 would shift the short-term bias to bearish, invalidating the current buy-the-dip setup and suggesting a deeper correction is underway.
Trading Strategy for This Session
For the Asian and early European session, patience is the key virtue. The strategy aligns with the technical setup: look to buy a dip into the identified support zone. A buy limit order between $4,781 and $4,785 offers a favorable risk-reward entry, targeting a breakout above $4,801 towards $4,815. A stop loss should be placed below the key support cluster, around $4,764.5, to protect against a false breakdown. This provides a clear 1:2 or better risk/reward profile. For traders who prefer a rules-based approach to such technical set-ups, our Price Action Pro EA automatically identifies and trades these support-based buying opportunities on the XAU/USD chart.
Risk Management
Position sizing is critical in a range-bound market ahead of a potential breakout. Risk no more than 1-2% of your account capital on this single setup. The 15-point ATR provides a logical measure for potential volatility; ensure your stop loss placement accounts for this. If price simply chops within the $4,785-4,801 range without triggering your entry, do not force a trade. The best action is often inaction. Wait for the market to show its hand with a clear break. For those who want to remove the emotional burden of risk management, consider using a Cloud Copy Trading service, where professional risk parameters are applied automatically to every trade.
Frequently Asked Questions (FAQ)
Q: Why is the gold price not moving much in the Asian session?
A: Asian trading hours typically have lower liquidity compared to European and US sessions. Major financial centers like London and New York are closed, leading to thinner trade volumes. This often results in consolidative, range-bound price action as seen between $4,785 and $4,801, as the market digests overnight moves and awaits fresh directional catalysts.
Q: What is the most important resistance level for gold today?
A: The most immediate and significant resistance is the confluence zone at $4,801-4,802. This level combines the session high, the 20-period EMA, and the 50-period EMA on the H1 chart. A decisive break and close above this area would signal bullish control and open the path towards the $4,815 target.
Q: How are Iran peace talks affecting the gold price?
A: Geopolitical tension is a major driver of safe-haven demand. Progress in peace talks reduces the immediate risk premium priced into gold. This acts as a headwind, capping rallies and encouraging profit-taking on long positions. However, the underlying inflation and monetary policy narrative often reasserts itself once the geopolitical headlines fade.
Q: Can I use an Expert Advisor (EA) to trade this kind of market?
A: Absolutely. Range-bound and breakout markets are ideal for algorithmic trading. A well-coded EA can monitor the key support and resistance levels ($4,785/$4,801) and execute trades the moment a breakout is confirmed, without hesitation or emotional bias. You can explore various Gold trading EAs designed for such strategies.
Conclusion
The Gold price forecast April 17 2026 Asia open centers on a battle for control near the $4,794 pivot. Bulls are defending the $4,785 support, viewing the current pause as a healthy consolidation before the next leg higher. Bears are testing the resolve at this level, hoping for a fundamental catalyst to push prices lower. The resolution will come from a break of either $4,801 resistance or $4,785 support. Until that occurs, patience and disciplined order placement at key levels are the hallmarks of a professional approach. The market is coiled; the next directional move is likely to be swift and tradable. To ensure you never miss a validated breakout signal, consider automating your strategy with our best-selling Gold trading bot, which operates 24/7 to capitalize on these precise technical setups.
Risk Disclaimer: Trading Gold (XAU/USD) involves significant risk of loss. This content is for informational purposes only and does not constitute financial advice. Always conduct your own research and trade responsibly.