Gold Price Forecast April 15 2026 Asia Open: Bulls Test $4,850 Ceiling
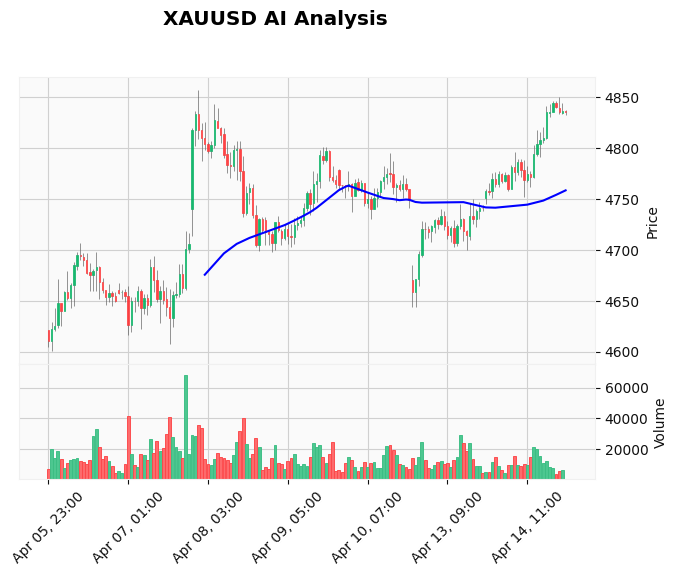
The Gold price forecast April 15 2026 Asia open centers on a critical battle at the $4,850 resistance zone. XAU/USD opens the Asian session at $4,835.29, having consolidated just below this major technical and psychological barrier. Fresh TradingView data confirms a strong bullish structure, with price trading well above all key moving averages. However, the Relative Strength Index (RSI) reading of 68.26 suggests momentum is approaching overbought territory, increasing the risk of a short-term pullback. The fundamental backdrop, driven by a weaker US Dollar on hopes for Iran diplomacy, remains supportive, but price action at this juncture requires patience. For traders looking to capitalize on the next decisive move without timing the market perfectly, our AI Trading Bot executes 24/7 on XAU/USD with an 83%+ win rate, managing risk automatically at such pivotal levels.
Gold Market Overview
The market sentiment for Gold remains cautiously optimistic as the Asian session commences. The metal is holding onto the majority of its recent gains, fueled by a sustained decline in the US Dollar. The DXY (Dollar Index) has sunk to a multi-year low, pressured by softer-than-expected US inflation data and growing market hopes that diplomatic efforts could de-escalate tensions in the Middle East. This macro theme of USD weakness is the primary fundamental pillar supporting gold prices. The price action reflects this, with XAU/USD respecting a clear bullish structure defined by the rising EMAs. However, the session is characterized by low volatility typical of Asian hours, with price compressing between the immediate resistance at $4,840.11 (today's high) and the first intraday support near $4,827.30. Traders are essentially in a holding pattern, awaiting either a catalyst or a technical resolution of the current consolidation.
Technical Analysis
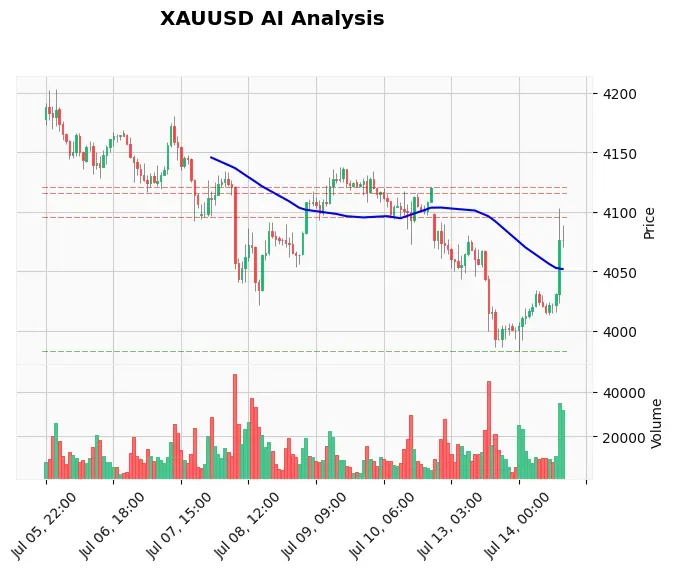
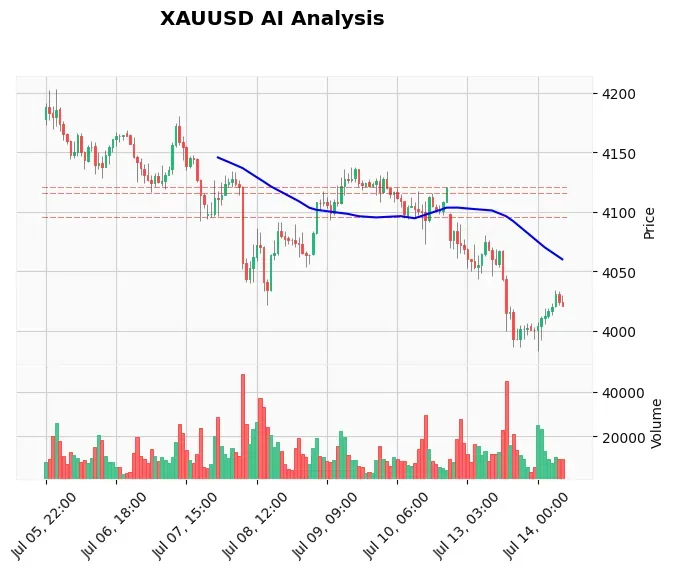
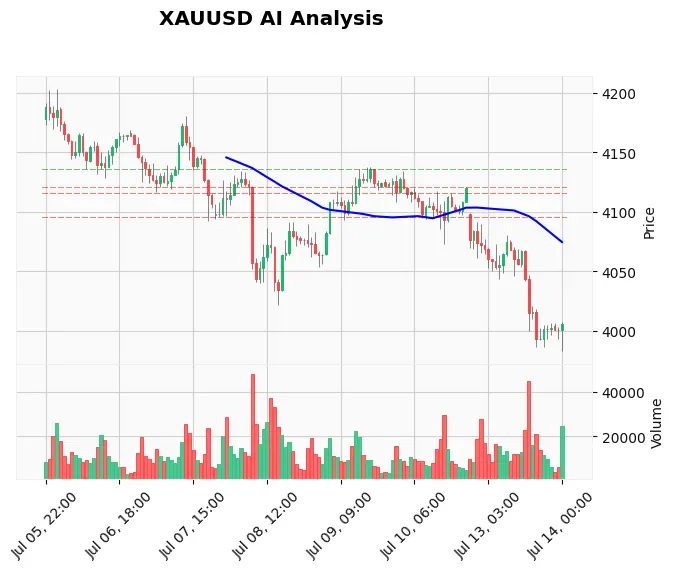
The technical picture is one of robust strength meeting a formidable wall. The daily chart structure is unequivocally bullish. The 20-period Exponential Moving Average (EMA) at $4,807.61, the 50-period EMA at $4,778.47, and the 200-period EMA at $4,724.48 are all aligned below the current price, providing a layered support base. The key levels from our live TradingView feed are clear: major resistance sits at $4,857.02 (R2), with initial resistance at $4,801.20 (R1) now acting as a support pivot. The most critical support zones for any pullback are $4,698.47 (S2) and $4,644.34 (S1).
The momentum indicators tell a more nuanced story. The RSI at 68.26 is not yet in extreme overbought territory (>70), but it signals that buying momentum is stretched and may be exhausting. The MACD remains positive at 22.92, above its signal line at 20.54, confirming the underlying bullish trend. However, the divergence between price making higher highs and the MACD histogram could foreshadow a momentum slowdown. The Average True Range (ATR) of 18.06 points indicates the recent daily volatility range, providing a guide for potential stop-loss placement. The chart shows price is at a tested resistance zone, and the fading momentum on lower timeframes suggests a pullback to retest the $4,800-$4,807 support cluster is a high-probability scenario before the next leg higher.
Fundamental Drivers
The fundamental narrative for Gold is currently dominated by US Dollar dynamics. News headlines from FXStreet and other sources confirm "Gold surges as Iran talks hopes dent US Dollar again." The prospect of reduced geopolitical risk is diminishing the Dollar's safe-haven appeal, directly benefiting gold priced in USD. Concurrently, last week's softer US inflation data has reinforced market expectations that the Federal Reserve may maintain a less aggressive policy stance for longer, keeping real yields in check. This combination creates a fertile environment for gold appreciation. There are no high-impact USD economic data releases scheduled for the immediate Asian or European session, meaning price action will likely be driven by technical flows and any breaking geopolitical headlines. For traders who want to automate their reaction to such sudden news-driven moves, our News Trading Bot is designed specifically to capture volatility around high-impact events.
Devil's Advocate
While the trend is undeniably bullish, the risk of a sharp corrective dip is real and must be respected. The primary invalidation scenario for the immediate bullish breakout is a failure to sustain momentum above $4,800. If the R2 resistance at $4,857 holds firm and buying volume dries up, profit-taking could trigger a pullback towards the $4,775-$4,780 area (the previous swing high and near the 50 EMA). A daily close below the 20 EMA at $4,807 would be the first technical warning sign that short-term momentum has reversed. Furthermore, if diplomatic progress is announced concretely, it could trigger a broader "risk-on" market move, temporarily reducing gold's safe-haven bid. The key reversal level to watch is a break and hold below $4,775, which would signal a deeper correction is underway.
Trading Strategy for This Session
Given the proximity to strong resistance and the overextended short-term momentum, the optimal strategy for the Asian session is patience. The AI system's decision to WAIT is prudent. Aggressive bulls should avoid chasing the price here. Instead, the plan is twofold:
- For a breakout: Wait for a clear, impulsive 4-hour candle close above $4,857. A retest of this level as new support could then offer a long entry with a stop loss below $4,830 and an initial target towards $4,900.
- For a pullback: A more favorable risk/reward long entry would be on a dip towards the confluence support zone of $4,800-$4,807 (R1/20 EMA). An entry in this zone with a stop loss below $4,775 targets a return to the $4,850-$4,857 highs.
This disciplined approach to waiting for confirmation or a better price is exactly the logic codified into our Price Action Pro EA, which identifies and trades such high-probability support and resistance setups automatically on the XAU/USD chart.
Risk Management
At elevated prices near resistance, strict risk management is non-negotiable. Position sizing should be conservative—risk no more than 1-2% of your trading capital on any single Gold trade initiated at this juncture. The ATR value of 18 suggests stop losses should be placed at least 20-25 points away from your entry to avoid being stopped out by normal market noise. The ideal risk-reward ratio for any setup here should be a minimum of 1:2. If a trade moves against you and hits your predefined stop loss, accept the loss and step back to reassess. Do not average down into a losing position. The goal is to preserve capital for the higher-confluence opportunities that will emerge after this resistance test is resolved.
FAQ
Q: Why is gold struggling to break above $4,850?
A: The $4,850 area represents a major technical resistance level where previous selling pressure has emerged. It's also a round psychological number that attracts profit-taking from traders who entered at lower prices. The current overbought RSI condition adds to the selling pressure at this zone.
Q: What is the main support if gold pulls back from here?
A: The first major support cluster is between $4,800 and $4,807, where the previous resistance (R1) and the rising 20-day EMA converge. A deeper pullback would target the $4,775-$4,780 zone, aligning with the 50 EMA and a prior swing high.
Q: Is the long-term trend for gold still bullish?
A: Yes, the long-term trend remains firmly bullish. The price is above all major daily Exponential Moving Averages (20, 50, 200), which are stacked bullishly. The fundamental drivers of USD weakness and geopolitical uncertainty continue to provide underlying support.
Q: What could cause a major rally in gold today?
A: A decisive break and close above the $4,857 resistance on strong volume would be a major bullish signal, likely triggering algorithmic buying and short covering. Alternatively, any headline indicating a failure in Iran diplomacy or a sudden spike in geopolitical risk would boost gold's safe-haven demand.
Conclusion
The Asian session opens with gold in a consolidation phase, a typical behavior after a strong rally and at a key resistance level. The $4,850-$4,857 zone is the line in the sand for bulls; a successful breach opens the path to $4,900 and beyond. However, the fading short-term momentum advises against immediate long entries. The strategic play is to wait for either a confirmed breakout or a healthy pullback to a stronger support zone. This disciplined, level-focused approach separates consistent traders from the reactive crowd. For those seeking to implement this systematic patience and execution 24 hours a day, our best-selling Gold trading bot manages these exact scenarios, entering only at high-probability levels and managing risk automatically, turning complex market analysis into streamlined results.
RISK DISCLAIMER:
Trading Gold (XAU/USD) involves significant risk of loss. This content is for informational purposes only and does not constitute financial advice. Always conduct your own research and trade responsibly. Past performance is not indicative of future results.