Gold Price April 29 2026 New York: Holds $4,520 – Bulls Eye $4,550
Gold (XAU/USD) is trading near $4,520 in early New York action on Wednesday, April 29, 2026, clinging to a critical support zone as traders square positions ahead of the Federal Reserve's interest rate decision at 2:00 PM ET. The Gold price April 29 2026 New York session is defined by a narrow intraday range between $4,510 and $4,530, reflecting extreme caution. With the Fed widely expected to hold rates at 3.75% and the statement likely hawkish, gold remains under pressure from a strong USD and rising oil prices. However, oversold RSI conditions on the hourly chart hint at a potential bounce toward the $4,550 resistance area. For those who want to trade this setup automatically, check out our AI Trading Bot – it runs 24/7 on XAU/USD with proven accuracy.
Gold Market Overview
The broader sentiment remains bearish as the DXY index pushes higher on safe-haven flows and expectations that the Fed will stick to its higher-for-longer narrative. Oil prices have climbed above $85 a barrel, adding to inflation concerns and further reducing the probability of early rate cuts. Gold has lost nearly $100 from last week's highs and is now approaching the psychologically significant $4,500 level. The market is in a wait-and-see mode, but the bias is clearly tilted to the downside. The upcoming FOMC decision and Powell’s press conference are the primary catalysts. A hawkish hold could trigger a break below $4,500, while a more cautious tone might allow a short-term relief rally.
Technical Analysis
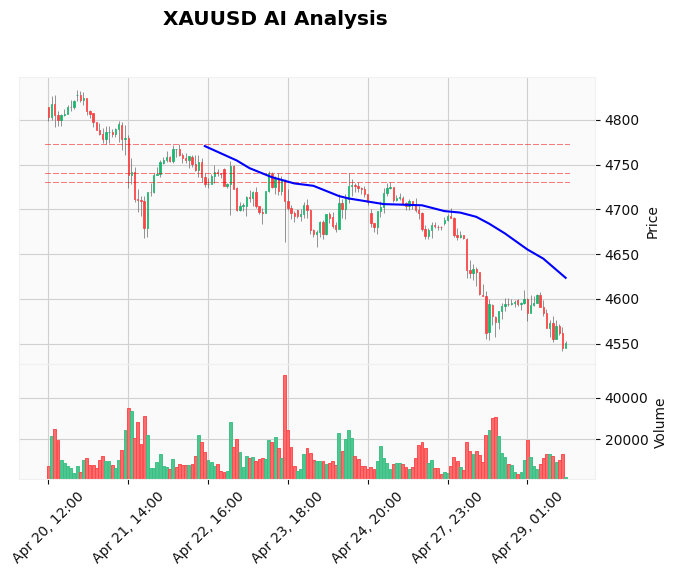
On the 1-hour chart, the short-term trend remains firmly bearish. Price is trading well below all major moving averages: EMA 20 at $4,577, EMA 50 at $4,614, and EMA 200 at $4,692. The RSI has dipped to 26.88, entering deeply oversold territory – a condition that often precedes a bounce or consolidation. However, the MACD is negative at -20.80 and below its signal line (-17.52), confirming dominant bearish momentum. The ATR of 20.17 indicates typical intraday volatility is around $20, meaning a break of the current range could be swift.
Immediate support is the intraday low near $4,510, followed by the key psychological support at $4,500 and then the $4,485 level (weekly low). On the upside, resistance is clustered between $4,550 (previous session high) and $4,570–$4,580 (recent swing highs). A break above $4,580 would challenge the $4,600 supply zone. The oversold RSI gives the bulls a fighting chance, but any rally is likely to be sold into unless the Fed surprises with a dovish tilt. For a deeper dive into price action and support/resistance levels, our Price Action Pro EA can automatically identify these zones and execute trades.
Fundamental Drivers
The primary driver today is the FOMC rate decision and Powell’s press conference. The base case is a hold at 3.50%–3.75%, but the statement may emphasize persistent inflation and data dependency. Higher oil prices add to the hawkish risk. However, recent US economic data has shown signs of softening (manufacturing PMI, jobless claims), which could make the Fed slightly more cautious. A hawkish outcome would likely push gold below $4,500, while a dovish surprise (e.g., hint at cuts later this year) could trigger a sharp rally toward $4,600. Geopolitical risks (Middle East, Taiwan) are present but currently overshadowed by rate concerns. Stay ahead of news-driven moves with our News Trading Bot, which trades high-impact events automatically.
Devil's Advocate
While the bearish case is strong, we must consider the opposite scenario. A dovish Fed – or even a neutral statement that acknowledges slowing growth – could lead to a sharp short squeeze. Gold is deeply oversold on the hourly chart, and with central banks continuing to buy, a bounce of $30–$50 is possible. Furthermore, if Powell downplays inflation concerns or signals that rates are near their peak, the USD could reverse sharply, sending gold back toward $4,600. The key level to invalidate the bearish bias is a break above $4,580 on a closing basis. Until then, the path of least resistance remains lower.
Trading Strategy for This Session
Given the pre-FOMC uncertainty, the best approach is to wait for the announcement before committing to a directional trade. Look for a sell opportunity if price fails to hold $4,500 after a hawkish outcome: enter on a retest of $4,500, stop loss at $4,530, first take profit at $4,485, second at $4,460. Conversely, if the Fed surprises dovishly, buy a break above $4,580 with a stop at $4,550 and target $4,600. For automated execution, our live Gold trading signals send precise entry alerts for these scenarios.
Risk Management
Position sizing is critical ahead of a high-impact event. Risk no more than 1–2% of your account per trade. Use wider stop losses (at least 1.5× ATR = $30) to avoid being stopped out by volatility spikes. If you trade the sell scenario and price reverses above $4,530, exit immediately. For buyers, a close below $4,500 invalidates the long thesis. Consider using trailing stops once the trade moves in your favor. For reliable 24/7 execution, our Telegram signal copier can automatically mirror these risk parameters to your MT4/MT5.
FAQ
Q: What is the gold price today in the New York session?
A: As of early New York trading on April 29, 2026, gold is hovering around $4,520, near one-month lows. The intraday range has been $4,510–$4,530, with traders awaiting the FOMC decision at 2:00 PM ET.
Q: Will the FOMC decision push gold below $4,500?
A: A hawkish hold – emphasizing persistent inflation and no early rate cuts – could easily push gold below $4,500. The next support is at $4,485, then the psychological $4,400 zone. However, a dovish surprise could reverse the move.
Q: Is the current RSI oversold reliable for a bounce?
A: RSI at 26.88 is deeply oversold on the hourly chart, which often precedes a bounce or at least a consolidation. However, in a strong downtrend, oversold conditions can persist. Look for a bullish divergence or a clear reversal candlestick pattern before entering a long trade.
Q: What are the key resistance levels for gold today?
A: Immediate resistance is $4,550, followed by $4,570–$4,580 (session highs) and $4,600. A break above $4,580 would signal a short-term trend change. For bearish traders, these levels are potential re-entry points for shorts.
Conclusion
The Gold price April 29 2026 New York session is poised for a decisive move once the FOMC decision lands. The bears have the upper hand with a strong dollar and hawkish expectations, but an oversold RSI and central bank buying provide a counter-narrative. The key level to watch is $4,500 – a break below opens the door to $4,485 and beyond, while a hold could trigger a relief rally toward $4,550. Whatever your bias, let data and price action guide you, not emotions. To automate your gold trading with proven algorithms, try our AI Trading Bot today – it’s built for precision and consistency in volatile markets.
Trading Gold (XAU/USD) involves significant risk of loss. This content is for informational purposes only and does not constitute financial advice. Always conduct your own research and trade responsibly.