Gold Traders Beware - $4,645 Level Cracks in New York
The Gold price April 07 2026 New York session finds itself in a tense standoff at $4,644, caught between geopolitical fear and pre-event paralysis. The metal is grinding in a tight $4,635 to $4,663 range, reflecting a market holding its breath ahead of high-impact US data and a critical geopolitical deadline. With momentum fading on the lower timeframes and the daily trend still bullish, this compression is a classic warning sign of an impending volatile break. Want to navigate this high-stakes compression automatically? Our AI Trading Bot is designed to execute 24/7 on XAU/USD, managing risk precisely during these uncertain periods.
Gold Market Overview
Market sentiment for Gold is conflicted and hesitant. On one hand, the looming "final" deadline from former President Trump to Iran is creating a tangible safe-haven bid, putting a floor under prices. On the other, traders are paralyzed by the imminent release of the FOMC Minutes and Core PCE data within the next 48 hours. These events will dictate the US Dollar's near-term trajectory, and by extension, Gold's. The DXY is consolidating, and bond yields are stable, leaving XAU/USD without a clear directional catalyst. This has resulted in a classic pre-event compression, where price action contracts into an increasingly tight range, storing energy for the next major move. The lack of follow-through in either direction today signals that big money is on the sidelines, waiting for the fundamental picture to clarify.
Technical Analysis
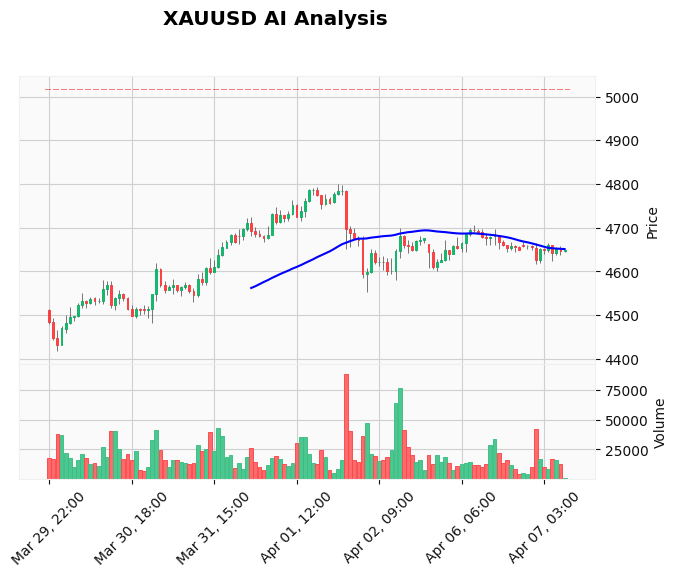
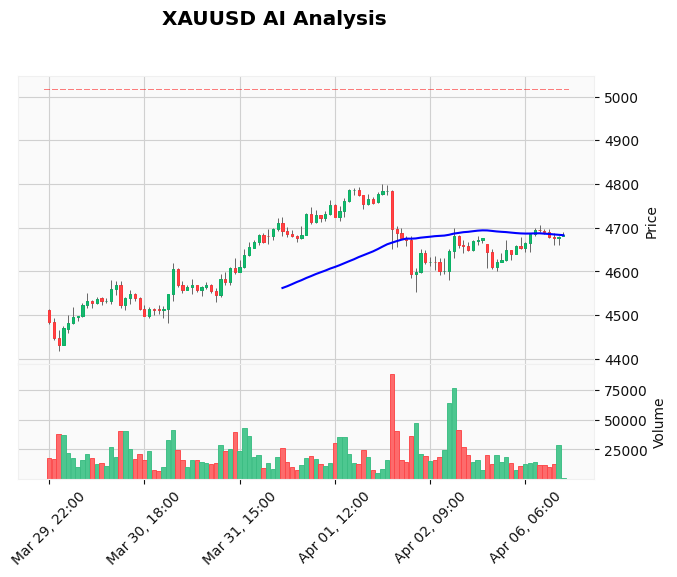
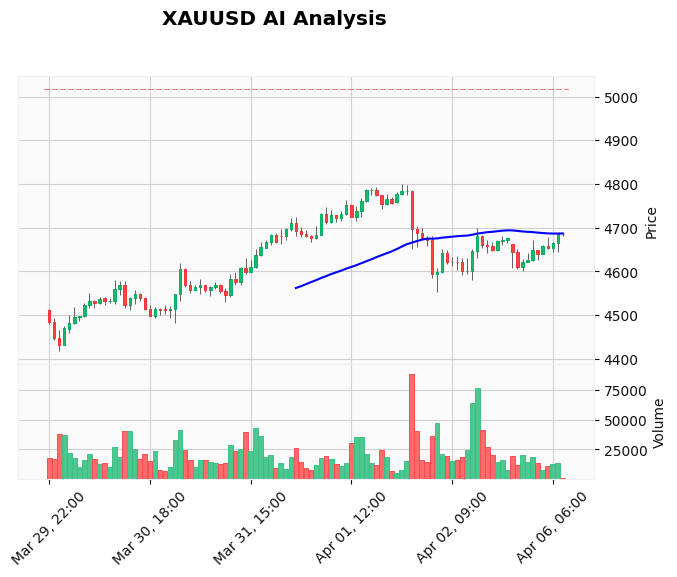
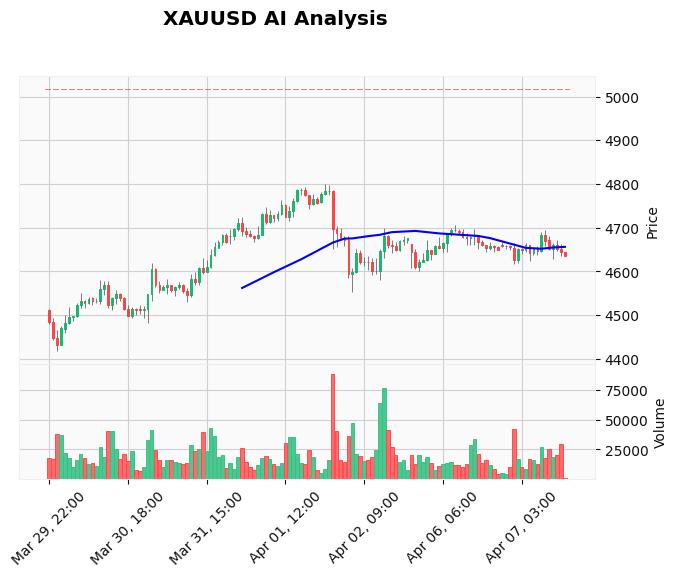
The technical picture for XAU/USD is one of consolidation within a larger bullish structure. Price is currently trapped between the immediate H1 range low of $4,635 and the high of $4,663. Critically, the price at $4,644 is trading below both the 20-period EMA ($4,656) and the 50-period EMA ($4,659) on the hourly chart, suggesting short-term bearish pressure. However, the 200-period EMA at $4,635 is providing dynamic support and aligns with the session low. The RSI at 45.71 is neutral, offering no strong momentum bias. The MACD is negative but converging, hinting at weakening downward momentum. The key levels from the TradingView system are clear: support rests at $4,554 and $4,351, while resistance awaits at $4,706 and $4,800. For today, the battle is between the $4,635 support and the EMA cluster around $4,656-4,660 overhead.
Fundamental Drivers
Two fundamental forces are wrestling for control of Gold. First is the acute geopolitical risk from Trump's ultimatum to Iran. Markets are on edge, and any escalation would trigger a immediate flight to safety, catapulting Gold higher. Second, and arguably more powerful for the session ahead, are the upcoming US economic releases. The FOMC Minutes will be scrutinized for clues on the Fed's tolerance for inflation and its rate path, while Core PCE is the Fed's preferred inflation gauge. A hotter-than-expected print could revive hawkish Fed expectations, boosting the Dollar and pressuring Gold. Conversely, a soft reading would weaken the USD and support XAU/USD. This creates a binary outcome setup. To trade these high-impact events without emotion, consider our News Trading Bot, which automates entries around volatile news spikes.
Devil's Advocate
The prevailing cautious bearish tone could be upended quickly. The entire consolidation could simply be a pause within the broader daily uptrend, absorbing selling pressure before the next leg higher. If the US data comes in dovish or the Iran situation deteriorates sharply, the bullish momentum could return with force, targeting the $4,706 resistance swiftly. The key level that would invalidate the immediate bearish pressure is a sustained break and close above the 20 and 50 EMA confluence near $4,660. This would shift the short-term structure back to bullish and likely trigger a run towards $4,690. Traders solely positioned for a breakdown could face a violent squeeze.
Trading Strategy for This Session
Given the compressed range and high event risk, the optimal strategy is to trade the breakout. A conservative approach is to wait for a confirmed break below $4,635 or above $4,663 with a closing hourly candle. For a bearish break, an initial target is the next support zone near $4,615, with a stop loss placed just above the breakout level at $4,665. For a bullish break, the first target is the $4,706 resistance, with a stop below $4,655. Position sizing must be reduced due to the elevated volatility risk from pending news. For traders who prefer a rules-based, technical approach to such breakouts, our Price Action Pro EA identifies and executes on these precise structural breaks automatically.
Risk Management
This is not a session for aggressive position sizing. The impending data and geopolitical headlines represent event risk that can cause gap moves and slippage. Risk no more than 0.5%-1% of your capital on any single trade entered today. The ATR of 27.25 points indicates the average daily range is still wide, so ensure your stop loss placement accounts for this volatility and isn't placed too tightly. Always have a pre-defined exit plan for both profit and loss before entering. If the trade moves against you, do not average down—honor your stop.
Frequently Asked Questions (FAQ)
Q: Why is Gold not rising with the Iran war risk?
A: Gold is exhibiting a typical "buy the rumor, sell the fact" dynamic regarding geopolitics. The risk has been priced in over recent days, and now the market is waiting for actual escalation or de-escalation. Furthermore, the counterweight of a potentially hawkish Fed is capping upside momentum, creating the current stalemate around $4,645.
Q: What is the most important Gold price level to watch today?
A: The $4,635 level is absolutely critical. It represents the session low, coincides with the 200-period EMA on the hourly chart, and is the lower boundary of the current consolidation range. A decisive break below this level would target $4,615 and likely shift short-term sentiment bearish.
Q: How will the FOMC Minutes affect Gold price?
A: The Minutes will be parsed for hints of the Fed's future policy stance. Any language perceived as more hawkish (concerned about persistent inflation) would be bullish for the USD and bearish for Gold. Conversely, a dovish tilt (emphasis on data dependence or potential for cuts) would weaken the Dollar and support XAU/USD.
Q: Is now a good time to buy Gold for the long term?
A> From a long-term perspective, the fundamental case for Gold remains strong due to central bank buying, geopolitical fragmentation, and fiscal concerns. However, for tactical traders, the immediate risk is to the downside if US data surprises hawkishly. Long-term investors might view a dip towards the $4,550 support as a better accumulation zone.
Conclusion
The Gold price April 07 2026 New York session is a coiled spring. The tight range between $4,635 and $4,663 is unsustainable, and the break, when it comes, is likely to be sharp. The direction will be dictated by the binary outcome of the Iran deadline and US inflation data. Traders must exercise extreme patience and discipline, waiting for a confirmed breakout before committing capital. The key insight is that the market's indecision is a signal itself, warning of high volatility ahead. Let our best-selling Gold trading bot handle the volatility for you, executing predefined strategies 24/5 regardless of market noise, so you don't have to stare at the charts during these tense moments.
Trading Gold (XAU/USD) involves significant risk of loss. This content is for informational purposes only and does not constitute financial advice. Always conduct your own research and trade responsibly.