Gold Price Analysis – Asian Session | March 26, 2026 | Caution Prevails Amid Mixed Signals
The gold market is starting the Asian session with a degree of uncertainty, following a day of conflicting signals. While some news sources call for continued downside pressure, others hint at a possible recovery. The key is to remain objective and not get caught up in the noise. The fact that major USD news is absent today adds another layer of complexity, leaving the market to react purely on technicals and lingering geopolitical fears. Investor Tipster is here to cut through the confusion and provide a clear strategy for navigating these choppy waters. If you're looking for a clear, data-driven breakdown of the gold market, stick with us. This analysis will give you the levels, scenarios, and tactics you need to trade XAUUSD effectively during this Asian session.
MARKET OVERVIEW
Currently, XAUUSD is trading around $4,410.77, holding near the upper end of its recent consolidation range. The daily chart shows a downtrend, which has been the dominant theme for the past few weeks, but the shorter-term momentum on the H1 chart suggests a potential for upward movement. This creates a tug-of-war scenario where neither bulls nor bears have a clear upper hand. The DXY (US Dollar Index) remains a crucial factor. A stronger dollar typically puts downward pressure on gold prices, while a weaker dollar can provide a tailwind for XAUUSD. Keep an eye on the US 10-year Treasury yield as well, as rising yields can make gold less attractive as a safe-haven asset. Overall, risk sentiment appears mixed. Middle East tensions are still simmering, which would typically boost gold's safe-haven appeal. However, concerns about global interest rates and a potential Fed hawkish stance are capping any significant rallies. This balanced scenario requires a cautious and flexible trading approach.
TECHNICAL ANALYSIS
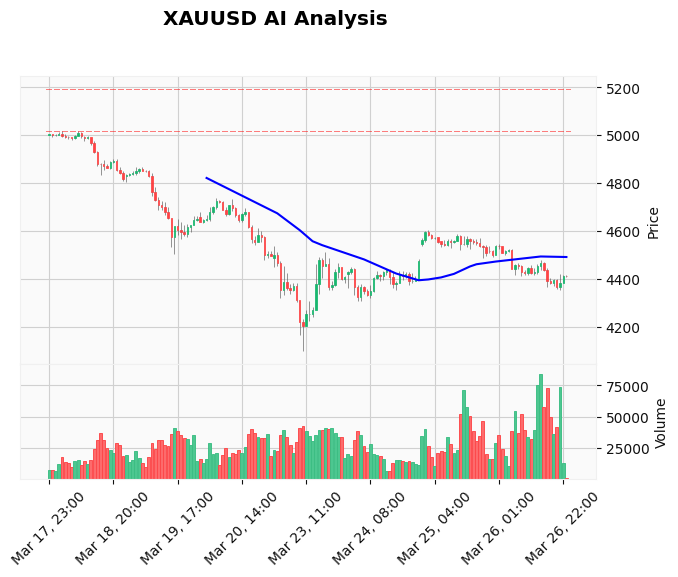
From a technical standpoint, several key levels are crucial to watch during this Asian session. On the support side, the immediate level lies at $4,380.97, followed by $4,350.00. A break below $4,350.00 would confirm the continuation of the downtrend and potentially trigger further selling. On the resistance side, the immediate level is around $4,431.00. A decisive break above this level could signal a shift in momentum and open the door for a test of higher resistance levels at $5,000 and $5,200. Indicator-wise, the RSI (Relative Strength Index) is hovering around the neutral zone, not providing a clear directional bias. The MACD (Moving Average Convergence Divergence) shows a potential for a bullish crossover, but it is not yet confirmed. The 200-day EMA (Exponential Moving Average) is acting as dynamic resistance, reinforcing the overall bearish bias. The H1 chart shows the price action as a downtrend followed by consolidation and a recent surge. The moving average (blue line) appears to be flattening, indicating a potential shift in momentum, although not confirmed. The increased volume towards the end of the chart might suggest growing buying interest, but needs further validation. [CHART IMAGE EMBEDDED HERE] Traders using the [AI Trading Bot](https://investortipster.com/marketplace/product/ai-trading/) had the $4,380.97 level flagged automatically – the bot's 83%+ win rate on XAUUSD speaks for itself.
FUNDAMENTAL ANALYSIS
The fundamental backdrop presents a slightly bearish picture for gold. Recent news headlines highlight concerns about Middle East tensions and the global interest rate outlook weighing on gold. Several sources are forecasting a potential decline in the price of XAUUSD. Specifically, increasing U.S. yields and strength in the dollar could lead to continued downside for gold. While geopolitical risks often provide a boost to gold prices, the market seems more focused on the potential for higher interest rates and reduced central bank easing. This is dampening the safe-haven appeal of gold and putting downward pressure on prices. The lack of major USD news events during this Asian session means that the market will likely be driven by technical factors and overnight news flow. However, traders should remain vigilant for any unexpected geopolitical developments that could quickly change the sentiment. If you trade Gold around news events, the [News Trading Bot](https://investortipster.com/marketplace/product/news-trading/) is built exactly for this – it executes trades automatically during high-impact releases.
DEVIL'S ADVOCATE — WHAT IF WE'RE WRONG?
It's crucial to consider the bearish scenario. What if the recent surge in price is more than just a short-term correction? What if the flattening moving average leads to a definitive bullish breakout? The key to invalidate the current bias would be a sustained break above the $4,431.00 resistance level. If the price manages to stay above this level for a significant period, the downtrend could be over, and a new upward trend might be emerging. Another factor that could invalidate the bearish bias is a sudden escalation of geopolitical tensions. A major conflict or unexpected event could trigger a massive flight to safety, driving gold prices sharply higher, regardless of interest rate considerations. Therefore, it is paramount to monitor the news flow closely and be prepared to adapt your trading strategy accordingly. Always keep a close eye on the news and have a trading plan that accounts for multiple outcomes. Remember, the market can shift quickly and without warning.
TRADING STRATEGY FOR ASIAN SESSION
Given the mixed signals and uncertainty, a cautious approach is warranted during this Asian session. The AI signal log indicates a WAIT signal, which aligns with the conflicting technical and fundamental outlook. However, a pending SELL_STOP order is set at $4,380.97 with a Stop Loss at $4,431.0 and a Take Profit at $4,350.0. Avoid chasing the price. Instead, wait for a clear breakout or breakdown from the current consolidation range. If the price breaks below $4,380.97, the SELL_STOP order will be triggered, confirming the continuation of the downtrend, and the trade will be executed automatically with the defined Stop Loss and Take Profit levels. Conversely, if the price breaks above $4,431.00, it might be wise to reassess the situation and consider a potential long position. However, be aware of the strong resistance levels at $5,000 and $5,200. Always adhere to strict risk management rules. Never risk more than 1-2% of your trading capital on a single trade. If you trade Smart Money Concepts, the [Price Action Pro EA](https://investortipster.com/marketplace/product/price-action-pro/) is cloud-based and catches these institutional moves automatically.
CONCLUSION & OUTLOOK
The gold market is currently caught in a tug-of-war between bullish and bearish forces. The downtrend is the primary trend to watch, but the short-term momentum might provide a test for higher resistance levels. This requires a patient and disciplined trading strategy during the Asian session. Monitor the key levels mentioned above and be ready to react to any significant breakout or breakdown. Pay close attention to the DXY and US yields as well, as they will continue to play a crucial role in influencing gold prices. For the next session, watch for any reactions to the Asian session's range—will it break out, or simply consolidate further? Want Gold signals like this delivered automatically? Our [AI Trading Bot](https://investortipster.com/marketplace/product/ai-trading/) runs 24/7, analyzes technicals AND fundamentals, and has maintained an 83%+ win rate on XAUUSD. It does the work while you sleep. New to trading? Start with our [Gold Trading Courses](https://investortipster.com/courses/courses/) and build a strategy that actually works. Running EAs around the clock? You need a reliable [Windows VPS](https://investortipster.com/vps/) so your bot never misses a trade. ⚠️ Risk Warning: Gold trading involves significant risk. Past performance is not indicative of future results. Never trade with funds you cannot afford to lose. This article is for educational purposes only and does not constitute financial advice.