Gold Live Analysis June 11 American Market: Why Today's Rally Above $4,080 Could Fade
Gold has staged a sharp intraday bounce, leaping from the psychological $4,000 floor to trade near $4,083 at the start of the American session. On the surface, the move looks impulsive, but a closer inspection of the technical structure shows that the broader trend remains firmly bearish. The $4,100–$4,120 supply zone sits directly overhead, and with no high‑impact US data on today’s calendar, this rally appears more like a counter‑trend correction than a genuine reversal. If you’re managing XAUUSD positions, understanding why this bounce is likely to fade will be critical for your session plan. Our AI Trading Bot has already locked in a sell limit right at the resistance zone – a perfect illustration of how automated strategies can capture these exact setups.
Gold Market Overview
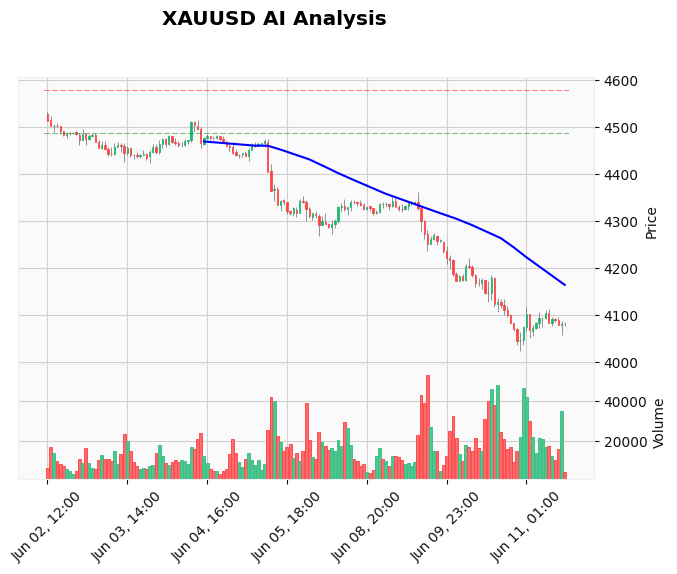
Today’s price action is a recovery rally taking shape after a brutal sell‑off that pushed gold to a six‑month low. The move started in late Asian trade and accelerated through the European session as short‑covering met bargain hunting. However, the macro backdrop remains tilted against the metal. The Federal Reserve’s hawkish stance, reinforced by tariff‑pass‑through inflation fears, is keeping real yields elevated and the US dollar supported. The ECB raised rates overnight, but that has done little to dent the greenback; EUR/USD shorts are stacking up, according to BofA, and the broad USD index is consolidating near recent highs. With the World Bank cutting global growth forecasts and a slew of negative gold headlines over the past 24 hours, the fundamental bias still points lower. The bounce from $4,000 is more about positioning than a change in the narrative. Until XAUUSD reclaims $4,100 on a daily close, the sellers remain in control.
Technical Analysis
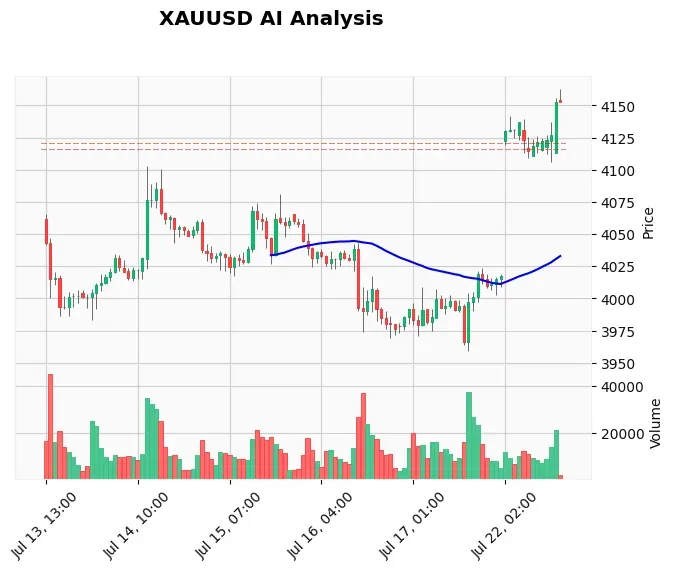
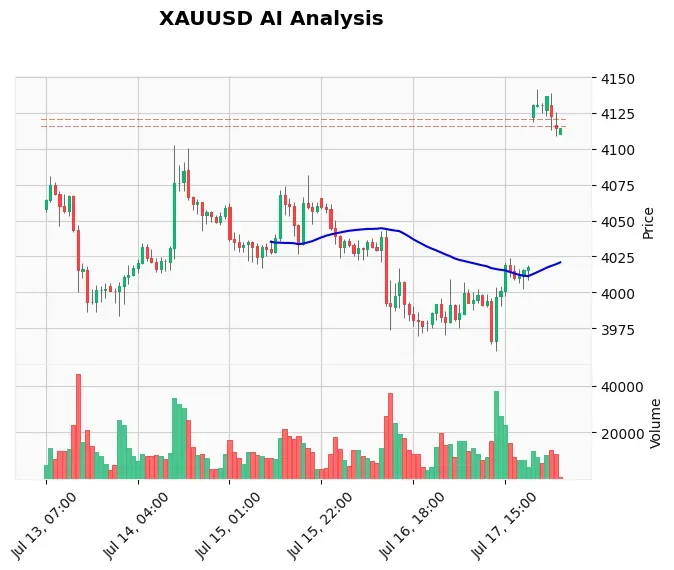
The 60‑minute chart shows a clear bearish alignment despite the afternoon pop. Price is currently trading at $4,083, but the 20‑period exponential moving average at $4,097.84 is acting as an immediate ceiling. The 50‑EMA ($4,156.29) and 200‑EMA ($4,323.40) are well above, confirming that every significant shorter‑term moving average is sloping downward. The relative strength index (RSI) reads 40.63, still in bearish territory but not yet oversold, leaving room for one more push higher before exhaustion. The moving average convergence divergence (MACD) histogram is printing positive bars (-20.95 vs. signal line -26.95), which explains the intraday momentum – but this is a classic bear‑market squeeze, not a trend change.
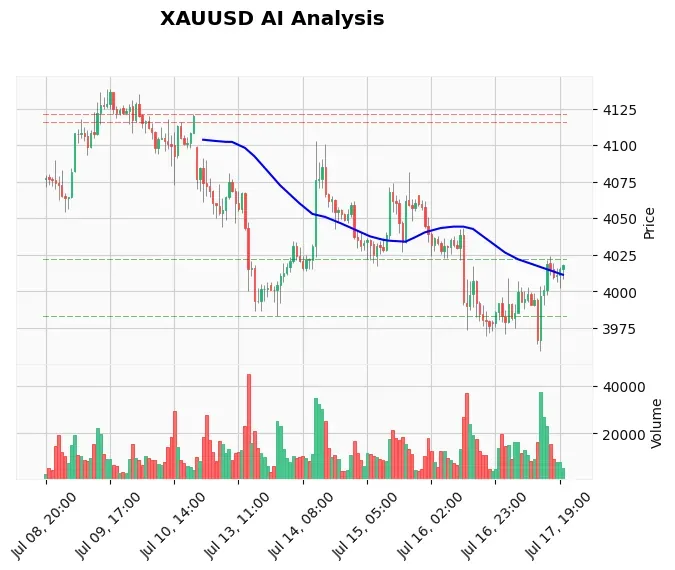
From a pure price structure standpoint, the daily chart has been carving lower highs and lower lows for weeks. The last meaningful swing high sits inside the $4,100–$4,120 resistance band, which also aligns with the 20‑EMA on the H1 chart. Below, the breakout area at $4,060 provides the first real support, followed by the $4,020 region and the psychological $4,000 level. Today’s average true range (ATR) of $26.55 suggests the market can move roughly $30 from its open, so a test of $4,100 is well within the session’s bandwidth. Yet any failure there is likely to unwind the entire bounce, sending price back toward $4,060 and lower.
Fundamental Drivers
The fundamental calendar is thin, and that in itself is a key driver. With no high‑impact USD events scheduled, gold is left to trade on technicals and residual macro themes. The overarching story remains the hawkish Fed, which continues to talk tough on inflation even as tariffs feed into consumer prices. This environment keeps gold’s medium‑term trend bearish. The ECB’s rate hike added a brief layer of uncertainty – a hawkish ECB could theoretically weaken the dollar and lift gold – but markets clearly doubt sustained tightening, and EUR/USD positioning is aggressively short. Consequently, the dollar remains king, and gold struggles to find buyers beyond short‑covering squawks.
Today’s slight uptick in gold is being fed by a “buy the rumor, sell the fact” reaction to the ECB move, plus some safe‑haven bids after a fresh round of US‑Iran hostilities pushed oil higher. However, these flashes of geopolitical noise have not altered the demand picture. The market’s focus is already pivoting to next week’s PPI and CPI data, which will test the Fed narrative once again. Until then, rallies into the $4,100 zone are likely to attract fresh sellers. If you trade news events, our News Trading Bot specializes in capitalizing on exactly these kinds of post‑headline fades.
Devil’s Advocate
The alternative scenario is that this bounce has more legs than the bearish case assumes. If XAUUSD manages a clean H1 close above the $4,100 resistance, it would also reclaim the 20‑EMA and could trigger a wave of algorithmic short‑covering. In that case, the next target becomes $4,120 – the daily swing high – and a break above that would force a serious re‑evaluation of the daily trend. For this to happen, however, the market needs a fresh catalyst, such as a sharp drop in the US dollar or a surprise geopolitical escalation. Nothing on today’s calendar provides that spark, so the bulls are fighting an uphill battle. Still, any trader holding a short bias must respect a clear break above $4,125; that would invalidate the immediate bearish setup and demand a quick exit.
Trading Strategy for This Session
The most logical trade for the American session is to fade the bounce at resistance. A sell limit at $4,100 offers a favorable risk‑reward, placing the stop loss just above the resistance zone at $4,125 – a 25‑point risk. On the downside, the first target is the intraday support at $4,060 (a 40‑point gain), followed by a second target at $4,020 (80 points from entry). If the broader bear trend resumes, the final take‑profit level at $4,000 would capture a full $100 move. That gives the trade a minimum 1.6:1 reward‑to‑risk ratio on the first target, with plenty of room to scale out.
The setup relies on price actually reaching $4,100, and current momentum suggests it will. If the market stalls just below that level, a more aggressive trader could consider a sell stop below $4,080 to catch a rejection. However, the limit order gives cleaner execution and avoids getting caught in whipsaws. For traders who prefer to let an EA handle these precise entries, the Price Action Pro EA is engineered to detect institutional supply zones like this one on XAUUSD and execute with a built‑in risk module.
Risk Management
Volatility remains elevated, with ATR at $26.55, so position sizing must account for wider swings. Never risk more than 1‑2% of your account on a single trade. With a 25‑point stop loss, a standard 0.10 lot position carries roughly $25 in risk, while a full 1.00 lot risks $250. A sensible approach is to risk no more than $50 on a $5,000 account, which would mean trading 0.20 lots. If the trade is stopped out, accept the loss and wait for the next clear setup; chasing price after a breakout is the fastest way to blow an account. The reward‑to‑risk on this trade is solid, but discipline is what keeps you in the game when the market does the unexpected.
Frequently Asked Questions
What is the key level for XAUUSD today?
The $4,100 resistance zone is the pivotal level. A clear H1 close above it would shift intraday bias to neutral‑bullish, while a rejection opens the door for a move back toward $4,060 and $4,000. Price has been oscillating around $4,083, so the next few hours will tell the story.
Why is gold falling despite geopolitical risks?
Geopolitical headlines – like the fresh US‑Iran tensions – typically offer only temporary support when the broader macro environment is dominated by a hawkish Fed and a strong US dollar. High real yields make non‑yielding gold less attractive, so safe‑haven flows are fleeting unless the event escalates dramatically.
How should I trade gold during the American session today?
The recommended approach is to sell into strength. A sell limit at $4,100 with a stop at $4,125 and targets at $4,060, $4,020, and $4,000 provides a structured, high‑probability trade. If price never reaches $4,100, it’s safer to stand aside than to chase a lower entry and risk being squeezed.
What is the daily trend for gold right now?
The daily trend is firmly bearish, with a series of lower highs and lower lows. Today’s bounce is a correction within that trend, and only a daily close above $4,120 would begin to question the bearish structure. Until then, rallies are considered selling opportunities.
Conclusion
Gold’s bounce off the $4,000 floor has injected a dose of noise into an otherwise clean bearish picture. The $4,100‑$4,120 resistance cluster is the line in the sand, and every technical indicator – from the descending EMAs to the below‑50 RSI – suggests sellers will defend it aggressively. With no major US data to fuel a breakout, the path of least resistance remains lower once this short‑covering exhausts itself. The sell limit at $4,100 offers a textbook risk‑reward setup, and locking it in now spares you the emotion of deciding in the heat of the move. For traders who want a systematic edge, our AI Trading Bot already has this trade mapped – just like it does every session for XAUUSD.
Disclaimer: Trading Gold (XAU/USD) involves significant risk of loss. This content is for informational purposes only and does not constitute financial advice. Always conduct your own research and trade responsibly.