Gold Live Analysis May 21 American Market: $4,500 Support Tested – Bears in Control
Gold edged higher in early American trading on Thursday after testing a fresh seven-week low near $4,488, but the bounce remains shallow as sellers defend the $4,520 resistance zone. This Gold live analysis May 21 American market highlights a market caught between a fragile support at $4,500 and a fast-falling EMA structure that keeps the pressure on the downside. For traders looking to capture moves without staring at screens all day, our AI Trading Bot executes entries and exits automatically based on the same technical confluence we analyze below.
Gold Market Overview
Sentiment in the American session remains cautious but leans bearish. The Dollar Index (DXY) has stabilized near 104.50, offering no fresh catalyst for gold to break higher. Meanwhile, the Iran‑related headlines continue to drive intraday volatility – the latest reports of uranium demands complicating negotiations have limited safe‑haven flows into gold despite geopolitical uncertainty. The macro environment is mixed: higher oil prices from supply disruption add inflationary pressure, but the market interprets this as a potential Fed‑hardening factor, which keeps the USD bid and gold capped.
Technical Analysis
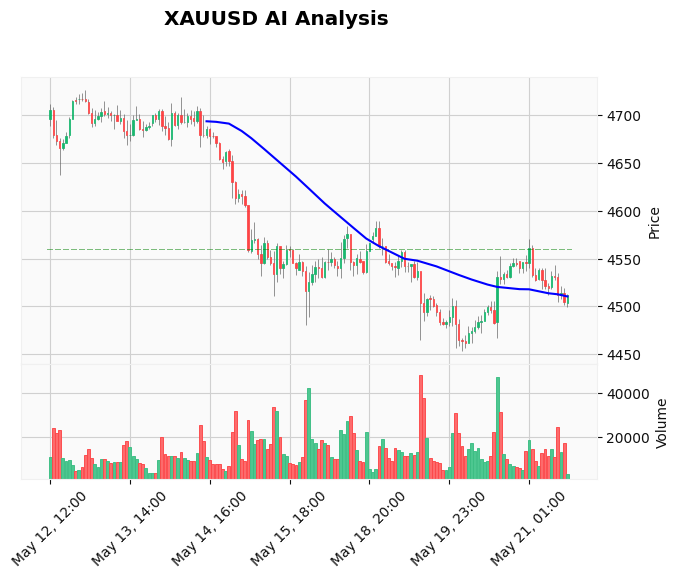
The 60‑minute chart shows a clear bearish setup. Price is trading at $4,513, below both the 20‑period EMA ($4,522) and the 50‑period EMA ($4,524). The EMA alignment – 20 below 50 below 200 – confirms a short‑term downtrend. The RSI at 46.36 is below neutral but not yet oversold, leaving room for further declines. The MACD histogram remains negative at -0.72, and the signal line at 3.30 is well above the MACD line, a classic bearish configuration. The ATR of $19.71 indicates that daily swings remain healthy, so a break of the $4,500 round number could accelerate the move towards the next support at $4,480 (S2) and eventually $4,453 (S1). However, note that the bounce from $4,488 earlier today suggests buyers are defending the $4,490‑$4,500 area aggressively. A close below $4,490 would confirm the breakdown; until then, expect choppy consolidation between $4,490 and $4,520. Chart available: a clear visual of the current structure can be seen on our platform.
Fundamental Drivers
There are no high‑impact US economic releases today, so gold is reacting purely to geopolitical and technical factors. The Iran negotiation impasse is the main headline: Iran's demand to enrich uranium at civilian levels has stalled progress, and while the lack of a deal reduces the risk of immediate de‑escalation, the market's reluctance to buy gold on this news suggests that traders view the situation as contained. The firmer USD is the dominant headwind. For automated traders, our News Trading Bot is designed to react to exactly these kinds of fundamental shifts in milliseconds, capturing moves before manual traders can react.
Devil's Advocate
What if the bears are trapped? If gold holds above $4,500 during the entire American session and manages to reclaim the $4,520 level, the short‑term momentum could shift. A close above the 20‑EMA ($4,522) would force many late shorts to cover, potentially sparking a rally toward $4,550. The key reversal level to watch is $4,530 – above that, the bearish thesis would be invalidated for this session. Given the oversold daily RSI (not shown here but below 30 on the daily chart), a sharp squeeze is possible.
Trading Strategy for This Session
With the trend clearly short and price near a critical support, we recommend waiting for a confirmed breakdown below $4,490 before entering a short position. Entry zone: $4,488‑$4,490. Stop loss: above $4,525 (above the EMA cluster). First take profit: $4,453 (S1). Second take profit: $4,430. Risk‑reward on this setup is roughly 1:2. If no breakdown occurs by 16:00 UTC, the setup expires. For traders who prefer a systematic approach, consider using a reliable Gold trading EA that can monitor these levels and execute with precision.
Risk Management
Position size should be limited to 1% risk per trade. With an ATR of $19.71, a stop loss of 35 pips is well within normal volatility. If the trade triggers and price reverses, respect the stop – do not move it deeper. The most dangerous scenario is hoping that $4,500 will hold again. If you are holding a short from higher levels, consider trailing your stop to breakeven once price reaches $4,460. For long trades, avoid buying the dip until a clear double bottom or bullish reversal candle forms above $4,490. Live Gold trading signals can provide real‑time updates on these exact risk parameters.
FAQ
Q: Why is gold falling despite geopolitical tensions in Iran?
A: Gold is being weighed down by a stronger US dollar and expectations that the Fed will keep rates high to fight inflation. The Iran war risk is already priced in to some extent, and without a sudden escalation, gold struggles to attract safe‑haven flows. The market is watching the $4,500 level closely; a break below it could trigger a wave of stop‑loss selling.
Q: What is the next support and resistance for gold in today's American session?
A: Support levels are at $4,490 (intraday low earlier), followed by $4,480 (S2) and then $4,453 (S1). Resistance is at $4,520 (20‑EMA), then $4,524 (50‑EMA), and the major hurdle at $4,550. The $4,525‑$4,530 zone is the key to a short‑term bullish reversal.
Q: Is it a good time to buy gold today?
A: Not yet. The trend is bearish on the hourly timeframe, and the MACD and EMA structures are both negative. A buy trade would only be justified if gold reclaims $4,520 with a strong candle and holds above $4,500 on a retest. Until then, the path of least resistance is lower.
Q: How can I trade gold automatically during the American session?
A: Our Telegram signal copier allows you to follow professional gold signals directly to your MT4/MT5. You can also use our Cloud Copy Trading platform to mirror the trades of experienced gold traders without manual intervention.
Conclusion
Gold is at a critical juncture in the American session. The $4,500 support has held so far, but the bearish technical setup – falling EMAs, negative MACD, and sub‑50 RSI – suggests that a breakdown is more likely than a breakout. The most important level to watch is $4,490; a break below it could open the door to $4,453 and below. Stay disciplined, manage your risk, and let the market prove itself before committing. For hands‑off execution, our AI Trading Bot is already scanning these price levels and can trade the breakout or bounce instantly while you manage other priorities.
Trading Gold (XAU/USD) involves significant risk of loss. This content is for informational purposes only and does not constitute financial advice. Always conduct your own research and trade responsibly.