Gold Live Analysis June 25 American Market – Key Levels
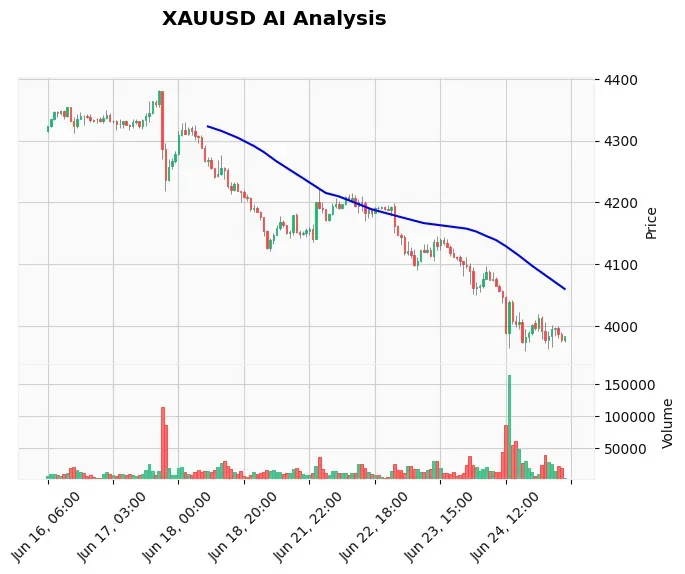
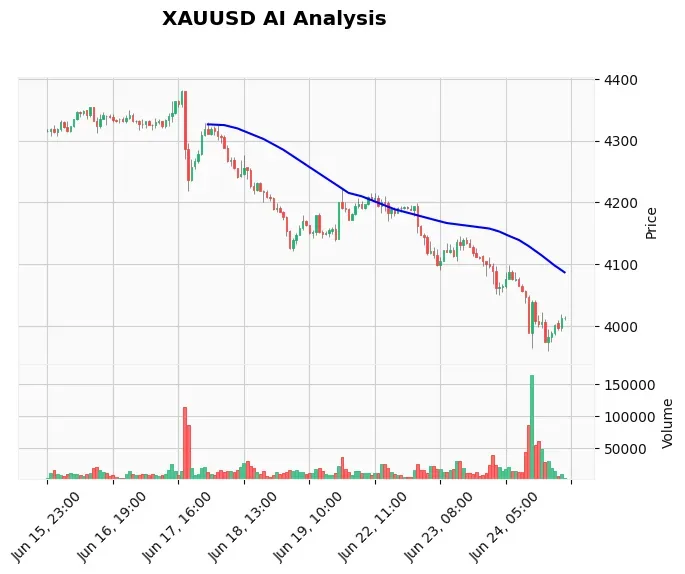
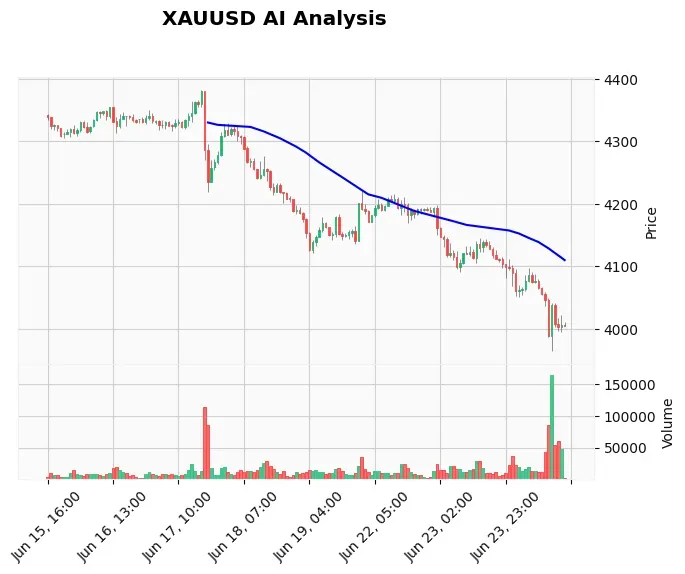
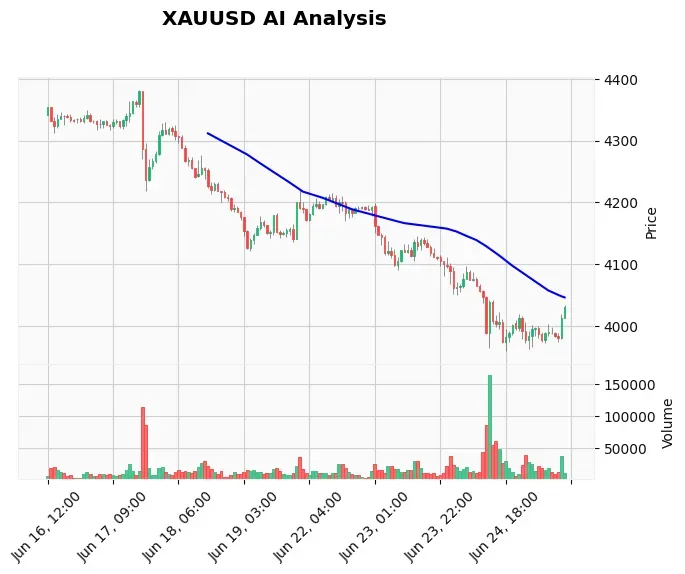
Gold (XAU/USD) is locking horns with the psychological $4,000 handle just as US traders return to their desks on June 25. The yellow metal broke decisively below that barrier early Thursday, hitting a session low of $3,978.84, but a swift bounce has pushed the price back toward $4,012 – directly into a zone where daily bears and short‑term bulls are now colliding. For anyone tracking the Gold live analysis June 25 American market, the real question is whether this bounce is a dead cat or the start of a more meaningful recovery.
Markets hate indecision, and that’s exactly what today’s tape is serving. Want to trade this setup automatically? Our AI Trading Bot runs 24/7 on XAU/USD, filtering out low‑conviction noise – exactly the kind of environment we’re in right now.
Gold Market Overview
The macro backdrop is unusually confusing this session. The US dollar is sliding after the latest PCE inflation data came in broadly in line with expectations, cooling fears of an aggressive Fed hike. A weaker dollar should be rocket fuel for gold, yet the metal’s daily chart is still nursing a gaping wound from the break below $4,000. Headlines from FXStreet and other outlets highlight gold’s worst level since November 2025, with SocGen noting an accelerated decline after key supports gave way.
At the same time, headline scanners flashed “US dollar slides as inflation numbers cool Fed hike talk.” This is the kind of mixed signal that traps traders on both sides. Bears want to press the breakdown toward $3,950, while bulls argue the PCE‑driven dollar weakness justifies a squeeze back to $4,050. Neither side has a knockout blow, and that leaves gold pinned in a narrow $40 range as the US morning unfolds.
Technical Analysis
The technical picture is a tug‑of‑war between a dominant daily downtrend and an urgent intraday bounce. Using the latest webhook and AI log data, here are the levels that matter:
- Current Price: $4,012.67 (close from the active 4‑H bar).
- EMA Stack: EMA20 at $3,999.89 is providing an immediate floor, while EMA50 at $4,041.95 is capping rallies. The EMA200 sits far above at $4,165.18, confirming a deeply bearish longer‑term structure.
- RSI (14): 51.18 – dead neutral, offering no bias.
- MACD: Still negative at -15.16, but the signal line (-20.61) has been crossed to the upside, hinting at waning downside momentum.
- ATR: 23.26 – elevated, meaning intraday swings of $20‑$30 are normal.
- Key Supports: $4,000 (psychological), then the day’s low at $3,978.84.
- Key Resistances: $4,023.87 (a former support now acting as resistance), followed by the EMA50 cluster near $4,041‑$4,050.
Notably, the 15‑minute chart shows surging bullish momentum, yet the 1‑H and 4‑H candles lack a decisive rejection. This often precedes a violent move once the US equity open flushes out the overnight noise. Traders who prefer rule‑based levels over gut feel can lean on tools like the Price Action Pro EA, which is built to react precisely at these structural boundaries.
Fundamental Drivers
Three fundamental threads are weaving today’s tapestry. First, the US PCE report – the Fed’s preferred inflation gauge – printed essentially on consensus. That has taken the sting out of hawkish re‑pricing and pushed the DXY lower by a few tenths. Second, the breakdown below $4,000 itself is a magnet for bearish flow; institutional desks often treat such breaches as triggers for new short positions. Third, there’s a noticeable absence of high‑impact US events on the immediate calendar, meaning afternoon trading will be driven purely by technicals and sentiment.
While the data tilt is mildly supportive for gold in the very short term, the structural damage from the $4,000 break hasn’t been repaired. A single in‑line PCE print isn’t enough to flip the daily chart from bearish to bullish. For traders who want to capitalise on these high‑volatility news reactions automatically, our News Trading Bot is designed to execute within milliseconds of key data drops.
Devil’s Advocate
What if this bounce isn’t a dead cat? The bullish case rests on a simple premise: the daily selloff from $4,220 to $3,978 has been aggressive and may be exhausted. If buyers can hold above $4,000 and reclaim the $4,024 level (former support‑turned‑resistance), a short squeeze toward $4,041‑$4,050 becomes highly probable. That scenario would be strengthened if US equities open weak and safe‑haven bids accelerate late in the day. The line in the sand for bulls is $3,978 – a close below that would invalidate any rebound narrative and likely trigger a fresh wave of selling toward $3,950.
Trading Strategy for the US Session
The AI analysis log (ID 4101) has issued a clear signal: WAIT. An existing short position from a previous setup has been cancelled at $4,029.76 because the clash between the daily bearish trend and the M15 bullish momentum creates a poor risk‑reward profile. That decision protects capital – and it mirrors what disciplined traders should do right now.
For those who must trade, a neutral‑day approach is to wait for a clear 15‑minute close above $4,024 or below $3,978 before committing. A break above resistance could target $4,041 with a stop under $4,012. A drop below support could aim for $3,958 with a stop above $3,985. Both setups should use reduced position sizes due to the ATR‐adjusted risk. Automating such breakout trades is exactly the kind of edge our AI Trading Bot delivers – it waits for confirmation and enters only when technical and fundamental pillars align.
Risk Management
Two‑way risk is unusually high today. The ATR of $23.26 means that a 20‑pip stop could easily be hit by random noise. Consider widening stops to at least 1.5x ATR (around $35) and keeping leverage low. Trail stops aggressively if the trade moves in your favour; the 4‑hour chart’s average bar range is over $40. Remember, no trade is better than a forced trade. Running your Expert Advisors 24/7 on a reliable Windows VPS ensures your risk management rules execute without interruption, even during US session volatility spikes.
FAQ
Why did gold bounce after falling below $4,000?
The bounce is fuelled by a softer US dollar after the PCE inflation data met expectations, cooling rate‑hike talk. Short‑term traders also covered profitable shorts near the psychological level, sparking a mechanical rebound.
What are the key levels for gold in the American session today?
Support sits at $4,000 and $3,978 (the day’s low). Resistance is layered at $4,024 and $4,041 (the 50‑period EMA). A sustained move beyond either boundary could dictate the next $20‑$30 swing.
Is it safe to short gold again after this bounce?
Shorting here requires patience. The daily trend is bearish, but the intraday momentum is bullish. A confirmed failure near $4,024 or a break below $3,978 would provide a safer entry with defined risk.
How does the US PCE data impact gold today?
The in‑line PCE print reduced hawkish Fed expectations, weakening the dollar and giving gold a slight bid. However, it hasn’t changed the dominant bearish structure created by the break under $4,000.
Conclusion
Gold traders are in a holding pattern. The raw breakdown below $4,000 screams “sell,” but the PCE‑fueled dollar drop screams “buy the bounce.” When opposing forces collide with this intensity, the only smart move is to stand aside and let the market pick a direction. Respecting the daily bear trend doesn’t mean you have to hit the sell button right now.
While you wait for the next clean setup, let our AI Trading Bot monitor XAU/USD around the clock. It thrives in exactly this type of sideways‑to‑indecisive market, stepping in only when probability and risk‑reward align.
Risk Disclaimer: Trading Gold (XAU/USD) involves significant risk of loss. This content is for informational purposes only and does not constitute financial advice. Always conduct your own research and trade responsibly.