Gold Live Analysis April 30 American Market: Momentum Builds as Dollar Drops
The New York session is off to a busy start as gold prices surge above the psychological $4,600 handle, driven by a sharp sell-off in the US Dollar following fresh intervention warnings from Japanese officials. This Gold live analysis April 30 American market breaks down the price action, technical structure, and key levels every trader needs to watch. If you want to automate your Gold trades around these moves, consider using our AI Trading Bot — it runs 24/7 on XAU/USD and captures high-probability setups like these.
Gold Market Overview
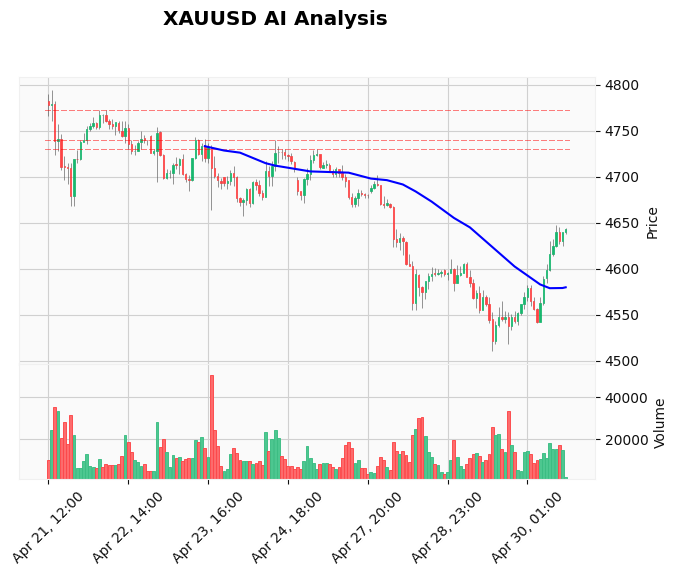
The precious metal is staging a strong recovery after a three-day sell-off, bouncing from Wednesday’s low near $4,570 to current levels around $4,610. The catalyst is a broad-based USD decline, with the Dollar Index falling over 1% after Japan’s Finance Minister Katayama issued a “final warning” on yen weakness, sparking intervention fears. The resulting JPY buying spree triggered long USD liquidation across the board, providing a powerful tailwind for Gold. Meanwhile, geopolitical tensions remain elevated — the Iran war and spiking oil prices continue to support Gold’s safe-haven appeal. However, the Federal Reserve’s hawkish hold yesterday, with Powell reiterating patience on rate cuts, caps the upside in the medium term. For now, the short-term momentum is clearly bullish, but traders must respect the overhead resistance that caught buyers earlier this week.
Technical Analysis
On the hourly chart, XAU/USD has broken above the previous session’s high and is now testing the 4640–4650 resistance zone — a level that has acted as a ceiling since Tuesday. The EMA structure is turning constructive: price trades comfortably above the 20-EMA ($4,593) and 50-EMA ($4,596), while the 200-EMA at $4,668 remains the next major hurdle. The RSI sits at 56.23, leaving room for further upside before entering overbought territory. The MACD is positive (14.73) and above its signal line (6.84), confirming strengthening bullish momentum. ATR at $21.48 suggests expanded daily ranges, which suits breakout strategies. The initial support is now at $4,600 (prior pivot), followed by $4,570 (Thursday’s low). On the upside, a clear daily close above $4,650 would likely trigger stops and open the path toward $4,680–$4,700. Conversely, failure to hold $4,600 could trap late buyers and revisit the $4,570 area. For a real-time view of these levels, check the chart available in our analysis system.
Fundamental Drivers
The main story today is the Japanese yen shockwave. After months of verbal intervention, Tokyo finally stepped up with a strong warning, sending USD/JPY tumbling over 300 pips. That avalanche of USD selling lifted Gold directly. Additionally, the European Central Bank held rates steady, with President Lagarde citing the Middle East war as a key risk to growth — reinforcing the stagflation narrative that benefits Gold. Oil prices remain elevated above $90 on supply disruptions from Iran, adding to inflation hedging demand. On the flip side, the Fed’s decision to hold rates yesterday and signal no urgency to cut keeps real yields high, which historically weighs on non-yielding assets like Gold. So while the short-term fundamental cocktail is bullish, traders should watch for a potential reversal if the dollar stabilizes after the initial shock. To trade these high-impact news events systematically, our News Trading Bot can execute entries and exits automatically around key data releases.
Devil's Advocate
Not everyone should blindly chase this breakout. The daily chart still shows a bearish sequence of lower highs and lows since the April peak near $4,800. Today’s move could simply be a retracement within the bigger downtrend before sellers step in again. If the dollar stabilizes or if fresh hawkish Fed commentary emerges, Gold could reverse sharply. A break back below $4,600 would confirm that the bounce is fading and negate the short-term bullish bias. Additionally, the 4640–4650 zone has already rejected price twice this week — a third failure would be a warning sign. Patience is key here.
Trading Strategy for This Session
Given the mixed signals between the bullish intraday momentum and the bearish daily trend, we favour a wait-and-confirm approach. The ideal long setup is a pullback to retest $4,600–$4,610 with a bullish candle confirmation, targeting $4,650 as TP1 and $4,680 as TP2. Stop loss below $4,570. Alternatively, if price clears $4,650 with a strong close above the Asian high, a breakout long can target $4,700. For those who prefer a more passive approach, you can mirror professional positions through our Cloud Copy Trading platform, which replicates the trades of experienced Gold analysts in real time.
Risk Management
Today’s range expansion means position sizing must be adjusted. With ATR at $21, a stop loss of 1.5× ATR would be about $32, so ensure your risk per trade does not exceed 1–2% of your account. If you are scaling into a retest of $4,600, use a smaller initial position and add only if price confirms above $4,630. Always have a plan for the opposite scenario: if the dollar recovers and Gold breaks $4,570, exit longs immediately. Remember, the best trades are the ones where you live to trade another day.
FAQ
Q: Is Gold a buy right now in the American session?
A: The short-term momentum is bullish, but price is approaching a key resistance zone at $4,650. A safer entry is on a pullback to $4,600 with a tight stop. Breaking above $4,650 with volume would confirm the bullish continuation.
Q: How is the Japanese yen intervention affecting Gold?
A: Intervention threats in USD/JPY triggered a sharp dollar sell-off, which directly boosts Gold since they trade inversely. The effect can be short-lived if the move is just verbal, so watch for follow-through.
Q: What are the key support and resistance levels for XAU/USD today?
A: Immediate support is $4,600, then $4,570. Resistance is $4,650 (near-term), $4,680 (weekly high), and $4,700 (psychological). A close above $4,650 would target $4,700.
Q: Should I use a Gold trading robot for this market condition?
A: Yes, automated bots can react faster to news-driven moves. The AI Trading Bot is specifically designed for XAU/USD and adapts to shifting volatility.
Conclusion
Today’s American session is a textbook example of how geopolitical and currency shocks can drive Gold $50 in a single move. The key level to watch is $4,650 — a confirmed breakout could open a run to $4,700, while a rejection would keep the daily downtrend intact. The market is at a fascinating crossroads: intraday bullish momentum versus daily bearish structure. Trade it with discipline, respect your risk limits, and don’t be afraid to stay on the sidelines if the setup is unclear. To stay ahead of these moves automatically, our AI Trading Bot monitors XAU/USD 24/7 and takes trades based on your risk settings. Try it today and let the algorithm do the heavy lifting.
Trading Gold (XAU/USD) involves significant risk of loss. This content is for informational purposes only and does not constitute financial advice. Always conduct your own research and trade responsibly.