Gold Live Analysis April 16 American Market: Bears Test $4,801
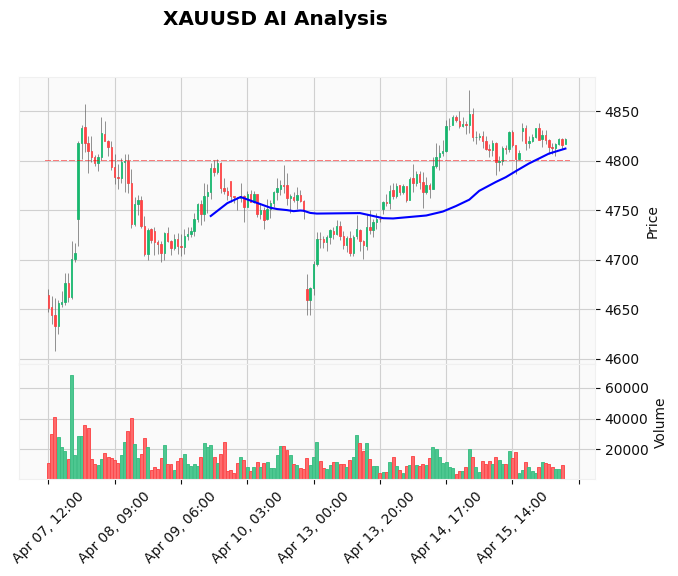
Gold is trading near $4,795 as the American session gets underway, with bears making a firm stand at the critical $4,801 resistance zone. This Gold live analysis April 16 American market update finds XAUUSD consolidating its Asian and European gains, caught between short-term bullish momentum and a significant technical barrier. The price has retreated from its intraday high of $4,823, signaling that sellers are active ahead of this key level. For active traders, this creates a classic high-probability setup: either a decisive breakout or a rejection-based pullback. For those seeking a hands-off approach, our best-selling AI Trading Bot is actively managing a profitable long position, having secured profits by moving stops to breakeven as price approaches its target.
Gold Market Overview: Range-Bound Amid Conflicting Narratives
The overarching theme for gold remains a tug-of-war between geopolitical safe-haven bids and persistent inflation concerns. Price action reflects this conflict, trading within a well-defined range. The dominant narrative centers on ongoing US-Iran talks, which provide a floor of support. However, countering this is commentary from Federal Reserve officials, like John Williams, warning that conflict is already driving up inflation pressures, which could keep monetary policy restrictive and cap gold's upside. The US Dollar has been on the backfoot, lending some support to XAUUSD, but without a fresh catalyst, momentum has stalled. The market intelligence points to a 'steady' or 'range' environment, perfectly describing the $4,784 to $4,823 box we are trading within. This sets the stage for a session likely defined by technicals rather than fresh headlines.
Technical Analysis: The Battle at $4,801 Resistance
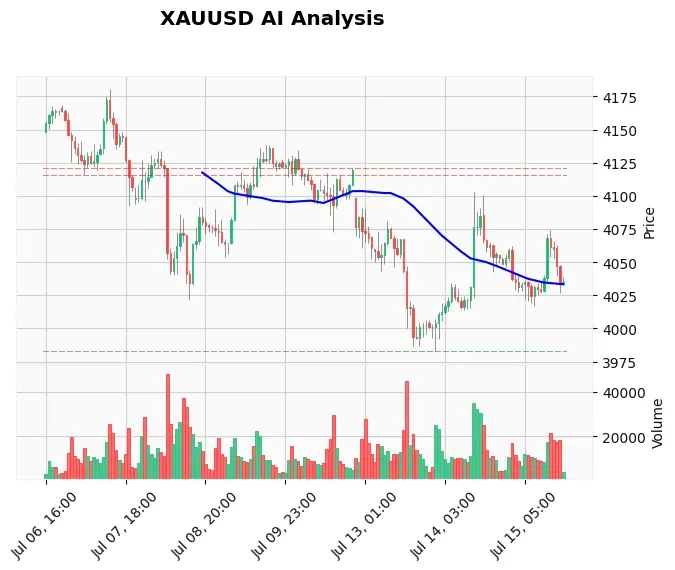
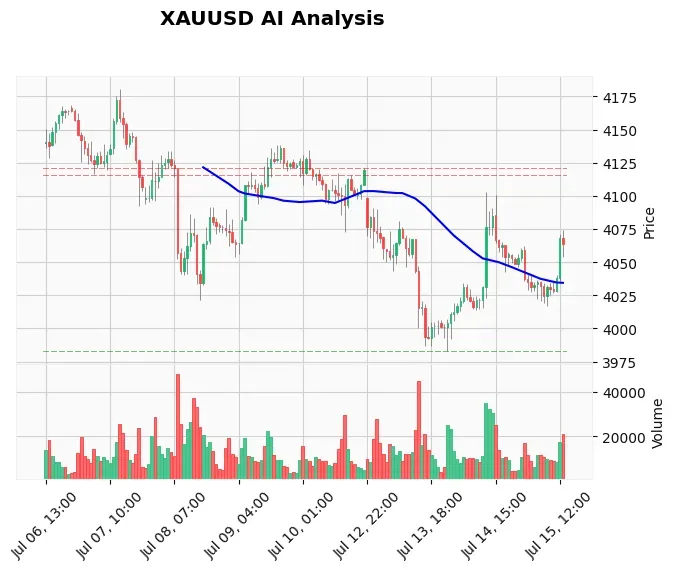
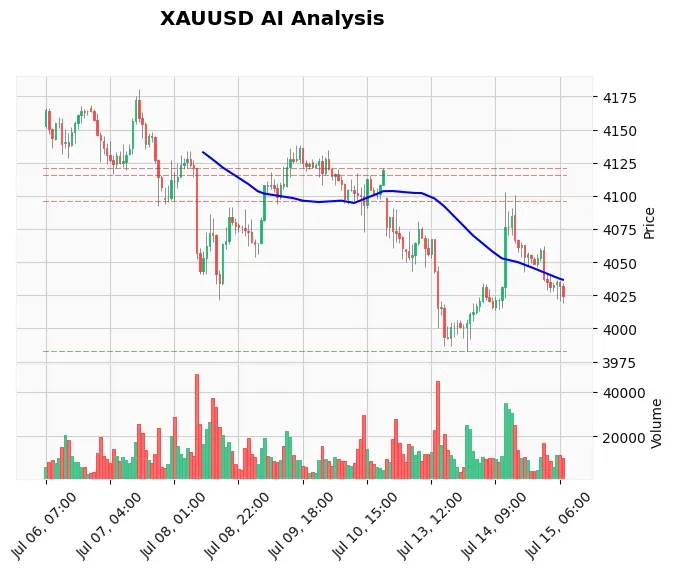
The technical picture is clear and actionable. Price is currently sandwiched between the immediate resistance at $4,801.20 (R2) and the session low support near $4,785. The broader weekly resistance sits higher at $4,871.31. The moving averages tell a nuanced story: the price is below the 20-day EMA ($4,814.83) and the 50-day EMA ($4,806.25), indicating short-term bearish pressure. However, it remains comfortably above the robust 200-day EMA at $4,751.81, confirming the primary long-term trend is still intact. The RSI reading of 41.4 is neutral to slightly bearish, leaving room for movement in either direction. The MACD, while positive at 0.61, remains below its signal line (2.77), suggesting bullish momentum is weak. The key takeaway is simple: a daily close above $4,801 opens the path towards $4,814 and $4,823 again. Failure here likely triggers a retest of $4,785 and possibly the stronger support zone around $4,698.
Fundamental Drivers: Geopolitics vs. Inflation
The fundamental backdrop provides context for the technical stalemate. On the supportive side, any escalation in Middle East tensions or breakdown in talks would send traders rushing into gold. The current 'hope for peace' narrative is limiting aggressive buying but also preventing a collapse. On the restrictive side, the market is digestiving the reality that inflation pressures aren't disappearing, keeping the Fed in a cautious, data-dependent mode. No high-impact US economic data is scheduled for the remainder of the session, meaning price action will be driven by technical flows, risk sentiment, and any unexpected headlines. For traders who want to capitalize on news-driven spikes without staring at screens, our News Trading Bot automates entries around high-impact events with precision.
Devil's Advocate: Why the Rally Could Fail Here
While the longer-term trend favors bulls, the immediate setup carries risk. The rejection from $4,823 and the struggle at $4,801 signal that selling pressure is real. If inflation fears begin to outweigh geopolitical concerns—perhaps on stronger-than-expected data later in the week—the dollar could find a bid, pressuring gold below the $4,785 support. A break and close below this level would invalidate the short-term bullish structure and target a deeper correction towards the $4,698 support area. Furthermore, the 'risk-on' sentiment from potential peace talks could ironically undermine gold's safe-haven appeal. The key level to watch for a bearish shift is a sustained move below $4,780.
Trading Strategy for the American Session
Given the tight range and clear levels, two primary strategies emerge. The first is a breakout play: a conservative buy order can be placed just above $4,805, targeting a move to $4,823 and then $4,831, with a stop loss below $4,795. The second is a rejection play: a sell order near $4,800 (with a tight stop above $4,805) targeting a pullback to $4,788 and then $4,780. The existing long trade from our analysis log exemplifies professional management—profits were secured by moving the stop loss to breakeven at $4,805 and extending the target to $4,830. This kind of disciplined, rules-based execution is exactly what our Price Action Pro EA is designed to replicate, identifying key order blocks and managing trades autonomously.
Risk Management: Navigating the Chop
In a consolidating market, position sizing is paramount. Risk no more than 1-2% of your account on any single trade triggered in this range. The Average True Range (ATR) of 16.48 pips provides a guide for realistic stop-loss placement; avoid stops that are tighter than the market's normal noise. If you take a breakout trade that fails and hits your stop, step back and reassess. Do not re-enter immediately. Wait for price to either reclaim the level with conviction or show a clear rejection at the next resistance. Patience in range-bound markets prevents death by a thousand cuts.
Frequently Asked Questions (FAQ)
Q: Is gold going up or down today?
A: Gold is experiencing two-sided action. It rallied earlier but is now facing selling pressure near the $4,801 resistance level. The immediate direction hinges on whether price can break above this barrier or gets rejected. The longer-term trend remains up, but the short-term is neutral within a range.
Q: What is the key resistance for XAUUSD right now?
A: The most immediate and critical resistance is $4,801.20. A clear break above this level is needed to signal strength and target the next resistance near $4,823 and $4,831. The major weekly resistance is higher at $4,871.
Q: Why is gold not falling despite potential peace talks?
A: Gold is receiving offsetting support from persistent inflation concerns, which keep real yields in check and the Fed's policy path uncertain. Furthermore, any peace negotiation is fragile, and the market is likely pricing in a degree of geopolitical risk premium that won't disappear overnight.
Q: How can I trade gold without monitoring it all day?
A: You can use automated trading solutions. For example, you can set pending orders at key levels like $4,805 or $4,795 with attached stop-loss and take-profit orders. Alternatively, you can subscribe to a reliable signal service and use a Telegram signal copier to auto-execute trades, or employ a fully automated expert advisor that trades 24/7.
Conclusion
The American session presents a classic technical battleground at $4,801. A successful defense by bears here could push gold back into the lower half of its recent range, while a bullish breakout opens the door for a retest of the day's highs. Traders should prepare for both scenarios but let price action confirm the next move before committing capital. The disciplined approach of securing risk-free profits on existing trades, as demonstrated in our live analysis log, is the hallmark of professional trading. For consistent, emotion-free execution of such strategies, consider leveraging our AI-powered XAU/USD bot, which applies advanced logic to manage trades, move stops to breakeven, and capture extended trends just as outlined in today's setup.
Risk Disclaimer: Trading Gold (XAU/USD) involves significant risk of loss. This content is for informational purposes only and does not constitute financial advice. Always conduct your own research and trade responsibly.