Gold Live Analysis June 19 American Market: $4,150 Cracks
This Gold live analysis June 19 American market unfolds with XAU/USD shattering the pivotal $4,150 floor as traders absorb another wave of greenback strength and Fed hawkishness. The spot price has tumbled to a fresh session low near $4,151, carving a third consecutive weekly loss and placing the psychological $4,100 target squarely in the crosshairs. With the daily trend firmly bearish and no immediate high‑impact data to rescue the metal, sellers are in command—yet a short‑term momentum divergence is forcing caution. To automatically trade this breakdown, our automated Gold bot with 83% win rate runs 24/7 on XAU/USD, executing entries without emotion.
Gold Market Overview
The North American session extends the selling campaign that began in Europe, driven by a hawkish Federal Reserve and a surging U.S. Dollar Index. The announcement of a U.S.–Iran interim peace deal has drained safe‑haven demand, removing a geopolitical bid that had cushioned gold earlier this year. Multiple news outlets highlight this as the third straight weekly decline, with FXStreet reports pointing to a $4,121 one‑week low and UOB analysts stressing that Dollar strength is the dominant force. The absence of high‑impact U.S. economic events today leaves the bearish macro narrative unchallenged, allowing the DXY to dictate price action. However, the lack of fresh negative catalysts could leave room for a technical bounce if short sellers begin to cover ahead of the weekend.
Technical Analysis
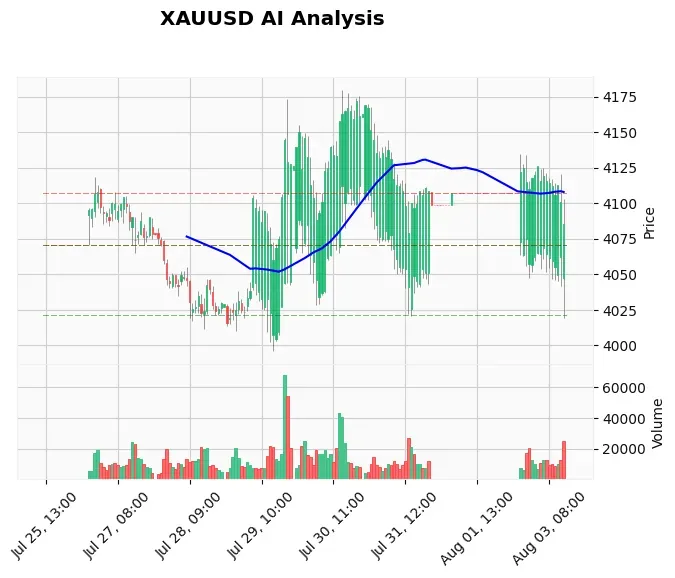
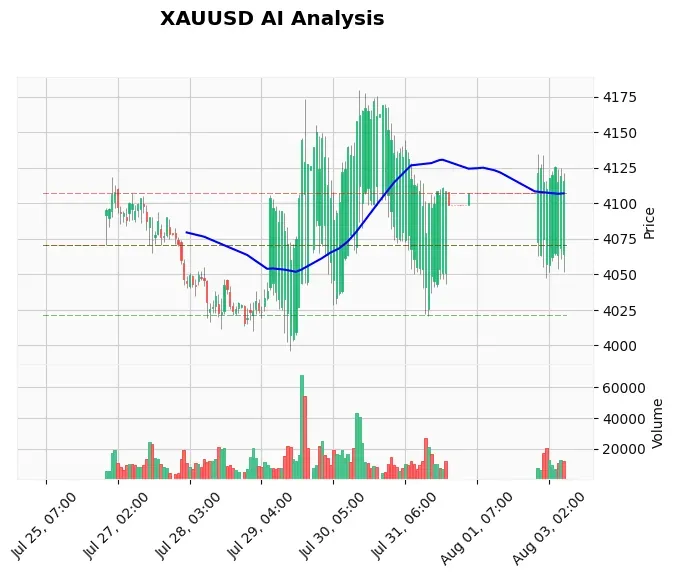
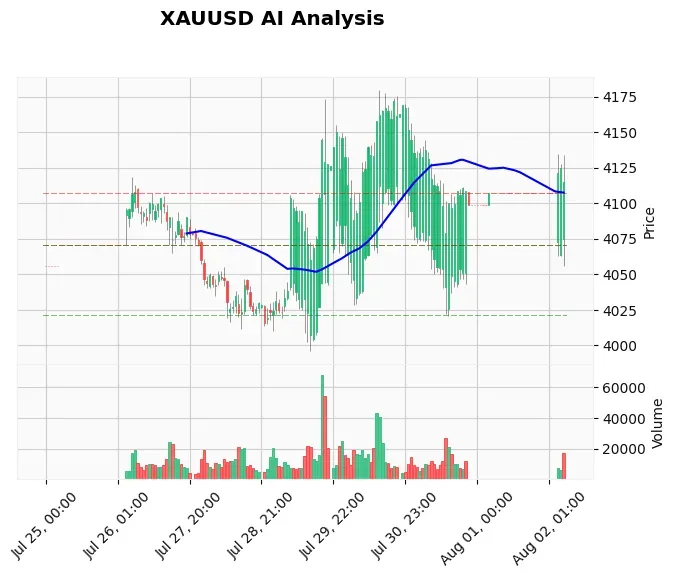
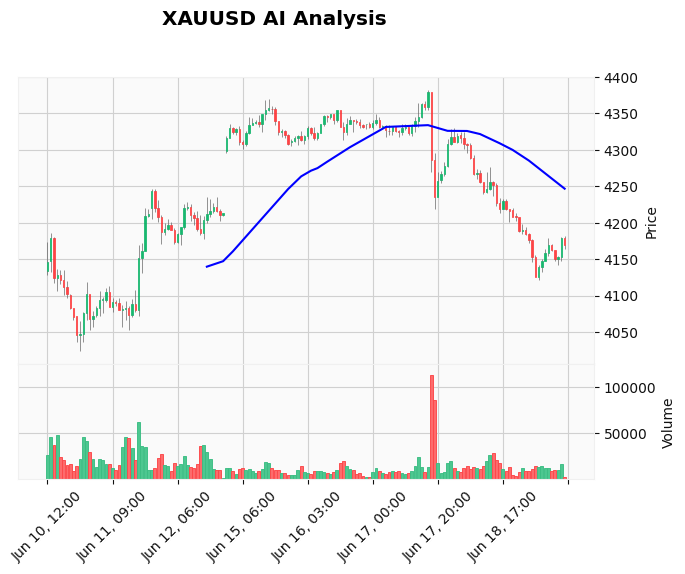
Gold’s hourly chart paints a deeply bearish picture following the close at $4,151.32. The metal is trading below all key exponential moving averages: the EMA 20 at $4,179.68, EMA 50 at $4,225.74, and EMA 200 at $4,279.65, confirming a death cross alignment that favors shorts. The RSI sits at 37.78, edging toward oversold territory but not yet extreme, suggesting that bearish momentum has room to extend before any mean‑reversion bounce. MACD prints a negative -26.07 against a signal line of -29.89, reinforcing the downtrend. Average True Range of 20.74 indicates respectable intraday volatility, which could see swings of $20+ in the American hours. Immediate support is now the session low at $4,121 – a level that our earlier professional XAU/USD signals identified as a key pivot – followed by the psychological $4,100 mark. On the upside, resistance clusters between $4,172 and $4,180 (the prior swing zone and the EMA 20). A close above $4,183.26 (the daily high) would be the first sign of weakening bearish control.
Fundamental Drivers
The dollar is king this week, boosted by hawkish commentary that keeps the possibility of another rate hike on the table. The fresh U.S.–Iran peace framework has eroded gold’s safe‑haven appeal, accelerating the decline. Even with no high‑impact data on today’s docket, the threat of next week’s FOMC minutes lingers, keeping long gold positions unattractive. For traders who want to capitalize on scheduled volatility, our automated Gold news bot is engineered to react to high‑impact events within milliseconds. Until then, the path of least resistance remains lower unless a sudden geopolitical shock or dovish Fed leak emerges.
Devil’s Advocate
The bearish case is lopsided, but a short‑squeeze is not off the table. The AI Analysis Log that shaped our earlier sell‑stop management flagged surging M15 momentum, which can trigger a sharp counter‑trend rally if buy stops above $4,172 are breached. If price reclaims $4,180 and pushes through the daily pivot at $4,183.26, a quick move toward $4,200 becomes plausible, invalidating the immediate bearish bias. The Fed’s narrative could also soften over the weekend if risk‑off flows return on unexpected headlines. Therefore, blindly shorting at current levels without confirmation risks being caught in a momentum trap.
Trading Strategy for This Session
Patience is the key to trading this environment. While the macro bias is firmly bearish, the stretched intraday decline and rising momentum odds suggest it’s unwise to chase shorts at $4,151. Instead, wait for a corrective rally into the $4,172–$4,180 resistance zone – the area where sellers are likely to reload. A bearish rejection from that zone, confirmed by a 15‑minute close below $4,165, would open a low‑risk entry with a stop loss above $4,185. Initial targets are $4,121 (the daily low) and $4,100. A break below $4,121, however, would confirm continuation and allow for a more aggressive short with a tight stop. Traders using algorithmic assistance can rely on our our SMC‑powered Gold EA to automatically identify these key supply zones and manage risk without hesitation.
Risk Management
Avoid allocating more than 1–2% of capital to any single trade. With an ATR of $20.74, a stop loss of $10–$15 from entry provides a healthy cushion while allowing for a risk‑reward ratio of at least 1:2. If the trade triggers but fails to break $4,121, consider trailing the stop to breakeven once price moves $15 in your favor. Never let an intraday play turn into a weekend carry without a clear hedge or a tight stop.
FAQ
Why is gold falling today? Gold is falling because the U.S. Dollar is strengthening on hawkish Fed expectations, while the U.S.–Iran peace deal reduces safe‑haven demand. The combination of a resilient dollar and fading geopolitical risk is dragging XAU/USD toward its third consecutive weekly loss.
What is the next support for XAUUSD? The immediate support is the daily low at $4,121, followed by the psychological level of $4,100. If $4,100 breaks, the next structural support from a broader perspective sits much lower, but a clean break of $4,100 would likely accelerate selling.
Is gold expected to drop below $4,100? Several analysts, including those at FXStreet, project a move toward $4,100 given the bearish macro backdrop. A close below $4,121 today would make the $4,100 target highly probable, especially if the dollar maintains its momentum into the close.
What would make gold turn bullish? A decisive hourly close above $4,183.26 (today’s high) followed by a push through $4,200 could signal a short‑squeeze and mark the beginning of a corrective rally. Reversal would require a fundamental shift, such as a sudden dovish Fed leak or an escalation in geopolitical tensions that revives safe‑haven flows.
Conclusion
Gold’s break below $4,150 leaves the $4,100 magnet wide open, but the final hour of the American session demands caution. The bearish trend from the daily chart is intact, yet the intraday momentum divergence warns that chasing shorts at these levels is a low‑probability bet. Wait for a pullback into the $4,172–$4,180 supply zone—or a confirmed breakdown below $4,121—before committing capital. If you prefer to leave the timing to a battle‑tested system, our AI Trading Bot has been navigating XAU/USD with an 83%+ win rate, removing the guesswork from high‑stress sessions.
Risk Disclaimer: Trading Gold (XAU/USD) involves significant risk of loss. This content is for informational purposes only and does not constitute financial advice. Always conduct your own research and trade responsibly.