Gold Price Forecast June 23 2026 Asia Open: Bears Eye $4,120
The Gold price forecast June 23 2026 Asia open finds XAU/USD trading at $4,193, stuck just below the psychological $4,200 level after an overnight range of $4,178–$4,194. Asian desks are opening to a market that remains heavy, with every bounce being sold as hawks dominate the macro narrative. The metal has failed to hold Monday’s modest gains, and the early price action suggests sellers are still firmly in control. Want to trade this Gold breakdown automatically? Our AI Trading Bot runs 24/7 on XAU/USD with an 83%+ win rate — no manual chart watching required.
Gold Market Overview
Following Monday’s session, Gold’s price action reflects a market that can’t catch a bid. The US Dollar Index remains firm above 103, buoyed by Fed speakers like Chicago President Goolsbee, who warned inflation is “well above target and going the wrong way.” Bank of America’s call for additional rate hikes this year reinforces the higher-for-longer narrative, draining safe-haven demand. Meanwhile, US–Iran peace progress reduces geopolitical risk premium — a double whammy for Gold.
Asian traders will be watching Shanghai Gold Exchange flows, but overall sentiment is tilted south. The lack of a significant catalyst during the Asia session leaves the US macro backdrop as the dominant driver. Until we see daily closes above $4,220, the path of least resistance stays down, and any intraday spikes toward $4,200 are likely to attract fresh sellers.
Technical Analysis
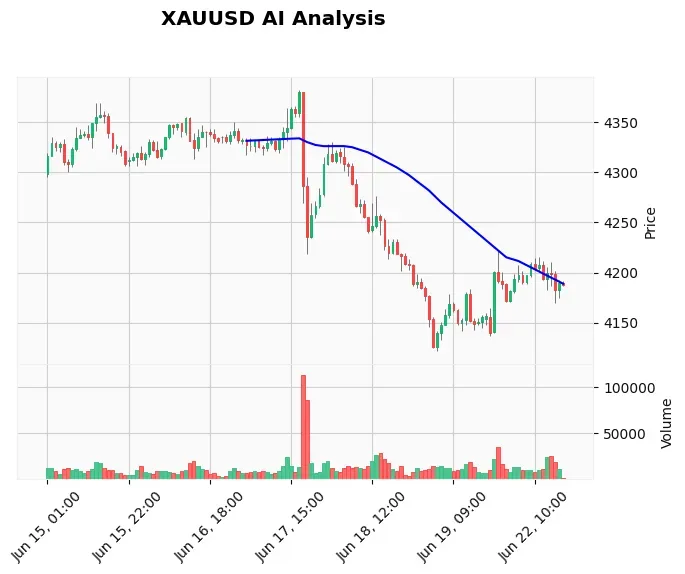
On the 60-minute chart, the EMA structure tells a bearish story. Price hovers just above the 20-period EMA ($4,189.81) but remains below the 50-period EMA ($4,199.97) and far below the 200-period EMA ($4,256.12). This alignment keeps the short-term downtrend intact, with moving averages acting as dynamic resistance.
The RSI sits at a neutral 51.71, leaving plenty of room for further downside before reaching oversold conditions. The MACD histogram is negative (MACD 0.80 vs. signal line 0.96), indicating momentum is fading on any small bounce. With an ATR of $15.94, the expected session range spans roughly $4,200 down to $4,170 — right where the battle will be fought.
Key support lies at $4,121.58 (S1), with a deeper floor at $4,023.76. Resistance is stacked at $4,382.15 and $4,369.24, but the immediate hurdle is $4,200–$4,208, where the pending sell limit from our AI Analysis Log sits. The chart pattern shows a clean sequence of lower highs and lower lows, and no reversal signals have emerged. Traders can view the attached chart for a visual of these levels.
Fundamental Drivers
Two high‑impact USD events loom: Core PCE Price Index m/m and Final GDP q/q, both due in roughly 60 hours. The PCE forecast of 0.3% (prior 0.2%) suggests inflation is creeping higher, which would trigger even more hawkish Fed rhetoric. A hotter print would likely send the dollar screaming higher and crush any Gold longs.
Fed speakers have been relentless. Goolsbee’s comments, combined with BofA’s expectations of multiple rate hikes, cement the bearish foundation. On the geopolitical front, the positive tone around US–Iran talks removes safe-haven demand that Gold normally enjoys during turmoil.
With the Core PCE release just two days away, many traders rely on the News Trading Bot to capitalize on volatility spikes automatically — a useful tool when high‑impact data hits.
Devil's Advocate
What could flip the script? A decisive hourly close above $4,200–$4,208 (above the EMA50 and the sell limit stop) would negate the immediate bearish bias and open a path to $4,250. If U.S. data surprises to the downside — especially a weak PCE print — Gold could stage a violent short‑covering rally that catches bears off guard. A sudden breakdown in US–Iran talks could also reintroduce a risk‑off bid. But with both technicals and fundamentals stacked against the metal, the probability of a sustained upside breakout during the Asian window remains low. The bearish bias stays valid as long as price respects $4,200.
Trading Strategy for This Session
The most disciplined approach is to wait for a pullback into the $4,200 resistance zone and sell with a tight stop at $4,208. Initial target is $4,160, with an extended target of $4,120–$4,100 if bearish momentum accelerates in the European or US sessions. Chasing price below $4,190 carries whipsaw risk, so patience pays.
For traders who prefer a systematic approach, the Price Action Pro EA executes SMC‑based orders exactly at liquidity zones like $4,200 — automating entries with precision. Manual traders can also consider a sell stop below $4,178 with a 15‑pip stop, but that requires careful monitoring.
Risk Management
With an ATR of $15.94, a 1:2 risk‑reward on a $4,200 entry down to $4,160 means risking roughly $8–$10 for a potential $32 reward. Keep position size under 1% of account equity. If price closes an hourly candle above $4,208, the setup is invalidated; cut losses quickly and wait for a fresh signal. Consistent risk discipline separates professionals from gamblers — if you’re serious about managing drawdowns and scaling your Gold trading, check out our professional Gold trading courses.
Frequently Asked Questions
Q: Why is Gold falling despite geopolitical tensions?
A: The positive progress in US–Iran peace talks is reducing safe‑haven demand, and hawkish Fed expectations are pushing real yields higher. These two forces together are outweighing any risk‑off impulse, keeping Gold under pressure.
Q: How will the Core PCE data impact Gold on Thursday?
A: A higher‑than‑expected PCE print (above 0.3%) would reinforce rate hike fears, likely sending Gold lower toward $4,100. A downside miss could spark a short‑covering rally toward $4,220, but the overall trend remains bearish until proven otherwise.
Q: What is the key support level for XAU/USD today?
A: The immediate support is $4,190 (current session low), followed by $4,178 (overnight low). If those break, the next major floor is $4,121.58 — the official S1 level. A daily close below that would open the door to $4,023.
Q: Is it safe to sell Gold at the current market price?
A: Selling at $4,193 carries whipsaw risk because price is close to the 20-EMA and the $4,200 resistance hasn’t been tested. A pullback entry near $4,200 with a defined stop offers a better risk‑reward profile. Patience is key during low‑liquidity Asian hours.
Conclusion
As the Asia session unfolds, the critical line remains $4,200. A failure to reclaim that level leaves bears in full control, with $4,120 as the next magnet. Gold’s inability to rally despite geopolitical noise tells its own story — the path of least resistance is down. We’ll reassess during the European session if price breaks above the EMA50. Our AI Trading Bot continues to navigate these swings with proven risk controls — another reason to let automation handle the heavy lifting.
Risk Disclaimer: Trading Gold (XAU/USD) involves significant risk of loss. This content is for informational purposes only and does not constitute financial advice. Always conduct your own research and trade responsibly.