Gold price forecast June 22 2026 Asia open: $4,120 or $4,020?
Gold has delivered a loud wake‑up call during the Asian window. A sharp intraday spike carried XAU/USD from the lows near $4,140 all the way to $4,200 — a $60 rally that looks dramatic on a 60‑minute chart. But as quickly as it arrived, the bounce is already meeting the gravity of a market that is structurally heavy. The broader backdrop remains defined by a hawkish Federal Reserve, a muscular US Dollar, and institutional research that is cutting gold forecasts, not raising them. For traders preparing their Asia‑session plan, this morning’s question is whether the spike to $4,200 is a short‑lived trap before the next leg lower, or the first sign of a floor. Our view leans firmly toward the former. Having an objective framework to navigate these swings is essential — that’s exactly why traders across the region rely on our automated Gold bot with 83% win rate to execute without emotion.
Gold Market Overview
The macro tone entering Monday’s Asian session is unmistakably bearish for precious metals. Last week’s FOMC meeting reinforced the narrative that the Fed is in no rush to cut rates, and market pricing now reflects almost no chance of a move this year. That reality has crushed the allure of non‑yielding assets. Goldman Sachs slashed its gold price targets, publicly walking back its previously bullish stance, while Silver collapsed below its 200‑day moving average in a clear warning shot for the entire metals complex. Meanwhile, the US Dollar continues to carve out multi‑month highs, with USD/JPY trading at levels not seen since 1986 — a testament to the rate advantage the greenback holds. Against this current, gold’s spike to $4,200 feels more like a powerful counter‑trend ripple than a genuine reversal. As long as the Dollar stays bid and rate‑cut expectations remain dormant, the path of least resistance for gold is down.
Technical Analysis
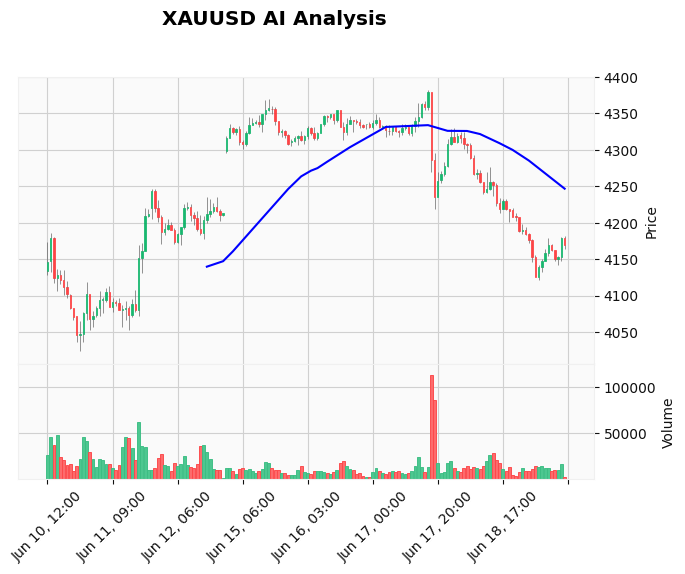
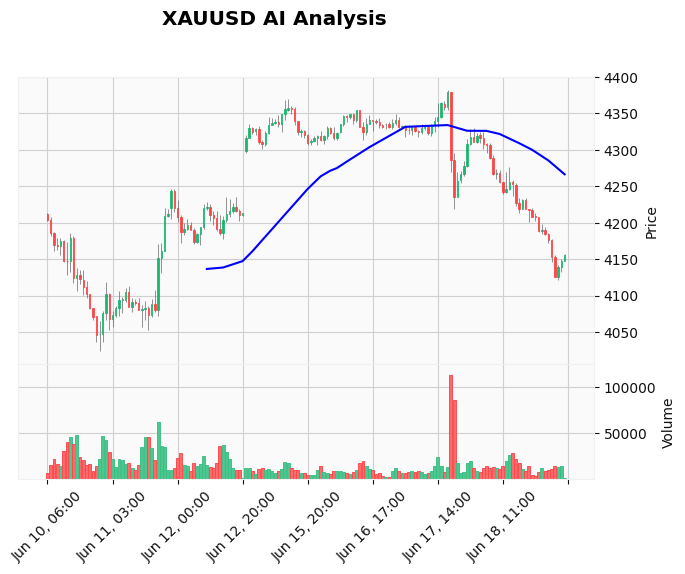
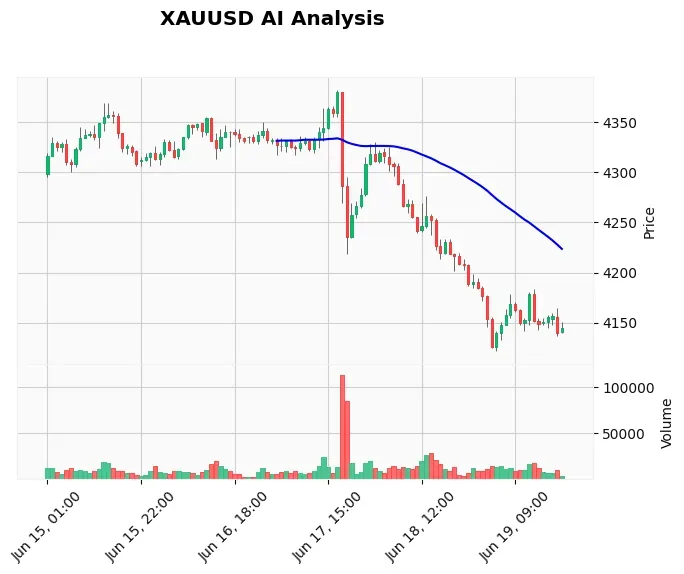
Despite the overnight fireworks, the daily and intraday frameworks remain aligned with a bearish continuation. The latest TradingView data for this Asia open shows the 20‑period EMA at 4,171.15, the 50 EMA at 4,211.62, and the 200 EMA at 4,272.62. Importantly, price is currently wedged between the 20 and 50 EMAs — a classic bearish flag environment. The 50 EMA has acted as a reliable dynamic resistance throughout this downtrend, and a rejection near that level would be entirely consistent with the pattern. RSI sits at a neutral 55, leaving plenty of room for another downside wave without becoming oversold. MACD is negative at -16.48, with the signal line at -23.39, and while the histogram is narrowing, it has not yet turned bullish — this typically suggests decelerating downside momentum, but not a reversal. ATR at 22.01 confirms elevated volatility, meaning stops need to be wide enough to avoid getting shaken out by noise. On the downside, the first major support rests at the session low of 4,140, followed by the 4,120 target that aligns with our proprietary signal. A larger structural floor sits all the way down at 4,023.76. Resistance is thick between 4,210 and 4,270, with the 200 EMA capping any sustainable upside.
Fundamental Drivers
The fundamental picture is what keeps us from interpreting the bounce as anything more than a technical correction. FXStreet intelligence notes that “Gold answers to the Fed, not the fear,” and the recent price action validates that. Hawkish Fed rhetoric has overpowered geopolitical noise, and headlines about US–Iran peace uncertainty have not been enough to shift the dial. More telling is the institutional repositioning: Goldman Sachs’ downgrade of gold targets reflects a broader consensus that the yellow metal will struggle without rate‑cut tailwinds. Looking ahead, the economic calendar holds two high‑impact USD events later this week — the Core PCE Price Index (forecast 0.3% vs previous 0.2%) and Final GDP (1.6%). Both are likely to reinforce the Dollar’s strength and keep gold under pressure. Using our News Trading Bot to navigate events like these can help traders avoid being caught on the wrong side of a data drop.
Devil’s Advocate
Every trade plan needs an invalidation point. The bearish thesis would shift if XAU/USD can reclaim the 50 EMA at 4,211 and hold above it on a 60‑minute closing basis. A push through the 200 EMA near 4,272 would be a far stronger signal that the trend is changing. For now, those levels are not being tested with conviction, and the spike to $4,200 already shows hesitation. A close back below 4,170 would strongly confirm that the bounce was a bull trap. Traders should always consider the scenario where the market proves them wrong and plan their risk accordingly.
Trading Strategy for This Session
Our existing plan, generated by the proprietary analysis engine, remains valid and has not been changed by the overnight spike. We are waiting for a SELL LIMIT order at 4,172, a level that sits just above the 20 EMA and within the lower band of the recent consolidation. The stop loss is tight at 4,180, giving a risk of only 8 points. The take‑profit target is 4,120 — a risk‑to‑reward ratio of 1:6.5 that aligns with the measured move of the bearish structure. If price fails to reach our entry and instead breaks below 4,140 with momentum, aggressive traders can consider a market entry with a stop above the spike high, but discipline is paramount. For those who prefer automated execution, our Price Action Pro EA is designed to capture these exact setups with precision and zero hesitation.
Risk Management
Gold is not a forgiving market, and sessions like this one — with a 22‑point ATR and aggressive intraday swings — demand strict risk controls. Position sizing should be calculated so that a stop‑loss to 4,180 represents no more than 1‑2% of total account equity. For a 1% risk on a $10,000 account, that may mean a smaller lot size than usual to accommodate the tight stop. We recommend running any active strategies on a reliable VPS to avoid execution gaps during Asian hours. Our 24/7 trading VPS ensures your platform remains connected even during the low‑liquidity window. Remember: a good trade that is over‑leveraged quickly turns into a bad one, regardless of the forecast.
Frequently Asked Questions
What is the Gold price forecast for Asia on June 22?
The forecast is bearish, targeting a move toward 4,120. Despite an overnight spike to 4,200, technicals and fundamentals favor further downside, with a sell‑limit entry at 4,172 being the preferred strategy.
Why did Gold spike to $4,200 in Asia?
The spike appears to be a liquidity grab during thin Asian trading, likely triggered by stop‑runs above short‑term resistance. No significant bullish catalyst supports the move, and it is already fading.
What are the key support levels for XAU/USD today?
Immediate support rests at 4,171 (20 EMA), followed by the session low at 4,140. The primary downside target is 4,120, with a major structural floor at 4,023 if selling intensifies.
How does the hawkish Fed affect Gold this week?
The Fed’s signal that no rate cuts are likely this year pushes up real yields and the US Dollar, making non‑yielding gold less attractive. Upcoming Core PCE data could reinforce this dynamic, keeping bears in control.
Conclusion
Asia’s spike to $4,200 may grab headlines, but it has not changed the core narrative. Gold remains trapped beneath a heavy ceiling of hawkish monetary policy and Dollar strength. The 4,172 sell‑limit offers a disciplined entry to ride the next leg lower, with a clear invalidation level and a six‑to‑one reward relative to risk. As the week unfolds with high‑impact US data, the bearish path is likely to stay congested — and potentially accelerated — by fundamental triggers. Trading this market without a systematic plan is a gamble; letting our AI‑powered XAU/USD trading bot handle the execution removes emotion and keeps you aligned with the dominant trend.
Trading Gold (XAU/USD) involves significant risk of loss. This content is for informational purposes only and does not constitute financial advice. Always conduct your own research and trade responsibly.