The Gold price forecast April 30 2026 Asia open points to a cautious session as XAU/USD stabilizes near $4,570 after a volatile post-FOMC selloff. The Federal Reserve held rates steady, Chair Powell confirmed he will stay on the board, and the dollar surged. Gold touched a low near $4,510 before bouncing sharply on the M15 chart, but the daily trend remains bearish. For Asian session traders, the key question is whether this bounce has legs or if sellers will reload near $4,600. If you want to trade this setup without staring at the screen all night, our AI Trading Bot monitors XAUUSD around the clock and executes based on real-time market structure.
Gold Market Overview
The macro picture remains dollar-positive. The FOMC decision delivered a hawkish hold — rates unchanged, but the committee split signaled a bias toward tighter policy for longer. Powell's confirmation that he will remain on the Fed board removes a layer of political uncertainty but reinforces continuity of hawkish guidance. The dollar index climbed to fresh weekly highs, and US Treasury yields followed suit, pressuring gold across all sessions.
Asian markets opened quietly, with liquidity thin ahead of the US GDP and Core PCE releases later today. The PBOC set the USD/CNY reference rate at 6.8414, a modest signal that did little to move the dollar. Geopolitical tensions around Iran and oil prices continue to simmer, but they have not provided the safe-haven bid gold typically enjoys. For now, the macro tailwind belongs to the bears.
Technical Analysis
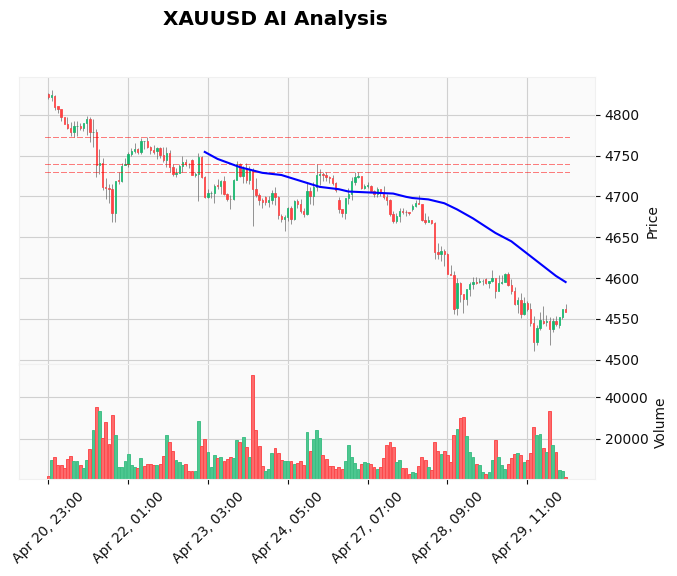
The 60-minute chart shows price compressing between the EMA 20 at $4,561 and the EMA 50 at $4,593. The EMA 200 sits far above at $4,678, confirming the bearish tilt in the medium-term structure. RSI at 50.79 is perfectly neutral — no overbought or oversold edge. The MACD histogram sits at -11.85 with the signal line at -16.41. Although the MACD is negative, the gap between the two lines is narrowing, suggesting the bearish momentum is losing some steam at these levels.
Support on the daily chart is well-defined at $4,510 (the post-FOMC low) and deeper at $4,485–$4,500 (psychological zone). Resistance is at $4,610–$4,620 (session high after the bounce) and then the $4,600 round number. ATR at 19.21 tells us that a 1% daily move is normal — so a push toward either boundary is entirely feasible within the Asian session. Price action traders can use the Price Action Pro EA to automate entries around these key levels with precision.
Fundamental Drivers
The economic calendar today is packed with high-impact USD data that will shape gold's next move. Advance GDP q/q is forecast at 2.2%, up sharply from 1.4% previous. Core PCE Price Index m/m is expected at 0.3%, slightly down from 0.4%. The Employment Cost Index q/q is forecast at 0.8%, up from 0.7%. If GDP and employment costs beat expectations, the dollar could rally further, pushing gold below $4,510. Conversely, a miss would give gold bulls a chance to reclaim $4,600.
Meanwhile, the Bank of England is expected to hold rates, and the UAE's exit from OPEC introduces medium-term oil supply risk. Higher oil prices feed into inflation expectations, which in theory should support gold as a hedge. But in the current environment, the market is prioritizing dollar strength and real yield direction over inflation fears. Stay ahead of these news-driven moves with the News Trading Bot, which executes trades instantly around high-impact data releases.
Devil's Advocate
What if this bounce is the start of a larger reversal? The M15 chart shows a sharp surge from the $4,510–$4,520 zone, and the MACD on that timeframe has already crossed bullish. If price clears $4,600 and holds above the EMA 50 at $4,593, the short-term structure flips. A close above $4,620 would invalidate the bearish bias entirely and open the door to $4,680. Traders with short positions near $4,600 should have a stop above $4,620 — and they do. The modified SELL_LIMIT at $4,600 carries a stop at $4,620 and targets at $4,530, $4,500, and $4,485.
Trading Strategy for This Session
The bias remains bearish, but the Asian session calls for patience. The current price of $4,570 is too far from both the entry zone at $4,600 and the support at $4,510 to justify a fresh position now. The best play is to wait for one of two scenarios:
Scenario A (Bearish): Price rallies toward $4,595–$4,600 during the Asian session. This fills the existing SELL_LIMIT. Target 1 is $4,530, Target 2 is $4,500, and the final target is $4,485. The stop at $4,620 keeps the risk small.
Scenario B (Bullish): Price breaks above $4,620 on strong volume. This invalidates the sell setup and suggests a shift toward $4,680–$4,700. In that case, look for pullbacks to $4,600 as potential long entries.
For traders who prefer to follow professional entries rather than build their own, our live Gold trading signals provide real-time buy and sell alerts with exact entry, stop, and target levels.
Risk Management
Position sizing for this setup should reflect the current ATR of $19.21. A standard risk per trade of 1% of account equity with a 20-point stop (from $4,600 to $4,620) means you can size up to 0.5 lots per $1,000 of capital. If price hits the stop, the loss is contained. If it reaches the final target at $4,485, the reward is more than 5x the risk. Keep a close eye on the 11:30 GMT data releases — volatility around GDP and PCE could spike spreads and cause slippage. Reduce position size by half during the news window.
Frequently Asked Questions
Q: Why is gold falling after the FOMC meeting?
Gold dropped because the Fed held rates steady and Chair Powell indicated he will stay on the board, reinforcing hawkish expectations. The dollar strengthened and yields rose, both of which are negative for gold in the short term.
Q: Is gold a buy at $4,570 right now?
Not yet. The daily trend is bearish, and the current bounce is a retracement within a downtrend. A buy becomes attractive only if price breaks and holds above $4,620, or if a deep retest of $4,510 holds and shows reversal confirmation.
Q: What are the key support and resistance levels for XAUUSD today?
Support: $4,510 (recent low) and $4,485–$4,500 (psychological zone). Resistance: $4,600 (round number) and $4,610–$4,620 (post-FOMC bounce high).
Q: How does the advance GDP report affect gold prices?
A higher-than-expected GDP reading strengthens the dollar and pushes gold lower, as it suggests the economy can handle higher rates for longer. A miss weakens the dollar and supports gold.
Conclusion
The Asian session sets the tone for the rest of the day, and today that tone is cautious but bearish-biased. Gold is caught between a short-term bounce and a strong macro headwind from the dollar and yields. The $4,600 level is the line in the sand — a rejection there keeps the sell scenario alive, while a break above $4,620 opens the door to a larger recovery. The safe play is patience: wait for the setup to come to you, respect your stop, and size for the volatility. For traders who want to automate their Gold strategy, our best-selling Gold trading bot delivers consistent entries with an 83% win rate across all sessions.
Trading Gold (XAU/USD) involves significant risk of loss. This content is for informational purposes only and does not constitute financial advice. Always conduct your own research and trade responsibly.