Gold Live Analysis June 30 American Market: Why Bounce Fails
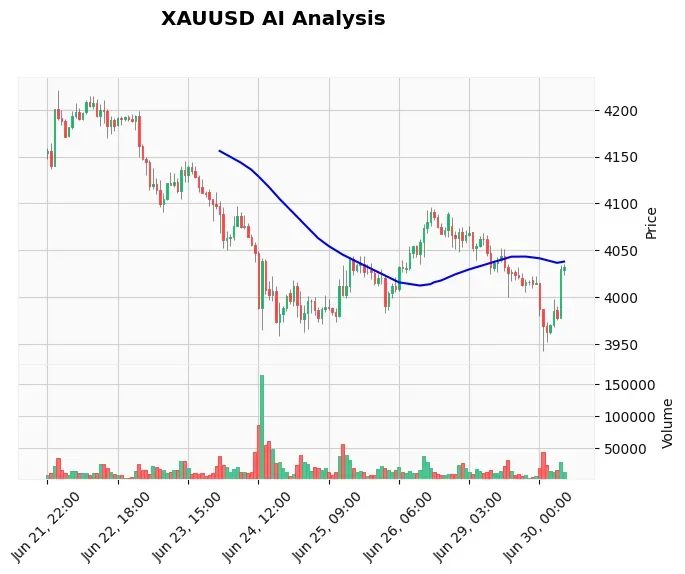
Gold’s attempted bounce above $4,000 is running out of steam as the US session kicks off. XAU/USD printed a fresh seven-month low of $3,941 earlier today, and while dip buyers pushed price back to $4,029, the $4,044 resistance zone stands firm. The macro environment is overwhelmingly bearish, with the US Dollar breaking 40-year highs against the Yen and hawkish Fed repricing gaining momentum. In this Gold live analysis June 30 American market, we break down why this rally is a dead-cat bounce and where the next leg lower begins.
Before you trade, consider automating your entries with our News Trading Bot that capitalizes on high-impact events like today's ISM PMI and Fed speech.
Gold Market Overview – American Session
The US dollar is tearing through long-term resistance, with USD/JPY vaulting above the 40‑year ceiling and USD/CHF coiling just below last week’s highs. The greenback is the story right now, and gold is paying the price. Traders have rapidly repriced Federal Reserve expectations following a deep quarterly loss; bets on a hawkish path are intensifying. A US‑Iran ceasefire has further removed a geopolitical tailwind, draining safe‑haven demand.
Against this backdrop, the afternoon’s high‑impact calendar only reinforces the bearish case. Fed Chairman Warsh speaks in about 23 hours, ISM Manufacturing PMI follows a day later, and Average Hourly Earnings data looms. Any upside surprise in these releases will amplify USD buying and sink gold. Even a neutral outcome keeps the fundamental bias firmly to the downside.
Technical Analysis – Gold (XAU/USD)
The daily chart remains in a bearish trend, and the latest bounce is struggling at the first meaningful ceiling. Immediate resistance sits at $4,044, a level that aligns with the EMA‑50 on the 4-hour chart and the R2 pivot from our TradingView webhook data. Secondary resistance is far higher at $4,095.99, giving sellers plenty of room to operate below $4,044.
On the hourly timeframe, price is hovering right around the EMA‑200 at $4,025.70. The EMA‑20 ($4,022.80) and EMA‑50 ($4,016.14) are sloping upward, forming a short‑term bullish stack, but RSI at 57.55 shows no overbought condition to fuel a breakout. MACD has dipped below its signal line, hinting that buying momentum is already waning. ATR sits at 9.91, suggesting a daily range of roughly $40 – enough to test $4,000 again before the session closes.
Support levels are clear: the psychological $4,000 floor and the S2 pivot at $3,941.10. A close below $4,000 would likely accelerate toward that seven‑month low. The bounce so far is textbook corrective, and unless bulls reclaim $4,044 with force, the path of least resistance remains down.
Fundamental Drivers Today
Two forces are hammering gold. First, the Federal Reserve’s hawkish repricing has lifted US real yields and the dollar index to levels not seen in months. Second, the US‑Iran ceasefire has defused a geopolitical flashpoint that was supporting safe‑haven flows. Commerzbank notes that gold suffered its worst quarterly loss since 2008, and the market’s reaction – short‑lived dip buying – confirms that any rallies are being sold into.
Upcoming events add to the bearish cocktail. Fed Chairman Warsh’s remarks could deliver a fresh hawkish surprise, and ISM Manufacturing PMI is expected above 53, signaling economic resilience. Average Hourly Earnings on Friday may reinforce wage inflation, keeping the Fed on a tightening path. With USD/JPY at fresh 40‑year highs, the dollar’s gravitational pull on gold is immense.
Devil’s Advocate – What Could Go Wrong for Sellers?
No trade is risk‑free, and three scenarios could torpedo the bearish view. First, if Chairman Warsh strikes a cautious tone or hints at a slower pace of tightening, the USD could tank and gold could spike through $4,044. Second, BCA Research warns that Russia tensions are an underappreciated market risk – an escalation would ignite safe‑haven demand. Third, gold is deeply oversold after the biggest monthly drop since 2008, and dip buyers are lurking near $4,000. A short‑squeeze could fuel a sharp rally above $4,044 without any fundamental trigger. However, the weight of the macro picture and the strength of the dollar make these tail risks; the base case remains firmly bearish.
Trading Strategy for the American Session
With resistance at $4,044 and the fundamental winds blowing bearish, fading any rally toward that level offers a high‑probability setup. A sell limit near $4,040–$4,044 with a stop loss at $4,060 (above Monday’s high) keeps risk well‑defined. The first target is $4,000, and a break below that opens the door to $3,950 and the $3,941 swing low. This aligns with our AI analysis log, which maintains a SELL bias and a protective stop at $4,060 while targeting a continuation lower.
For traders who want a systematic approach to these exact zones, our Price Action Pro EA automatically identifies smart money resistance and places trades with precision, removing emotion from the equation.
Risk Management
Given the ATR of $9.91, a $20 stop loss is reasonable – it allows for normal noise without getting whipsawed. Position sizing should limit risk to 0.5%–1% of capital on any single idea, giving the trade room to breathe through news releases. If the trade fails and price closes above $4,060, the bearish thesis is invalidated and it’s best to step aside. For 24/7 execution without downtime, a reliable Windows VPS for Gold trading ensures your platform never misses a tick, even during high‑volatility news.
Frequently Asked Questions
Why is gold falling despite the bounce above $4,000?
The bounce is purely technical, driven by short‑covering after a seven‑month low. The dominant fundamental forces – a strengthening US dollar, hawkish Fed repricing, and reduced geopolitical risk – are all bearish for gold. Until those drivers shift, rallies are likely to be capped.
What is the next target for XAU/USD if $4,044 holds?
If $4,044 resistance holds, the next logical target is a retest of the $4,000 psychological level, followed by the $3,941 low. A break below $3,941 would expose $3,900 and potentially $3,850. For real‑time entry alerts on these levels, check our live Gold trading signals.
Could the Warsh speech change the bearish outlook?
Absolutely. If Fed Chairman Warsh signals a pause in tightening or expresses concern about economic growth, the dollar could weaken sharply and gold could break above $4,044. That’s the biggest event risk this week, and traders should management positions accordingly.
How should I position for the US session with this conflict between technicals and fundamentals?
When technicals and fundamentals clash, the higher‑timeframe fundamental bias usually wins. The daily chart is bearish, and the macro story is overwhelmingly negative. The safest approach is to wait for a rally into $4,044 and then sell, rather than chasing the bounce. If you’re already short, tighten stops to protect profits.
Conclusion
Gold’s bounce is fizzling exactly where bears want it – at $4,044 resistance. The US dollar remains unstoppable, Fed hawks are in full control, and geopolitical de‑escalation is removing the last safe‑haven bid. The $4,000 round number will be tested again, and a break below could open a fast lane to $3,950 and the year’s low. Stay patient, wait for the rally, and sell into strength.
When the trend is this clear, let our AI Trading Bot handle the XAU/USD execution with 24/7 precision and a proven 83% win rate. No emotion, just the math.
Trading Gold (XAU/USD) involves significant risk of loss. This content is for informational purposes only and does not constitute financial advice. Always conduct your own research and trade responsibly.