Gold Trading Setup June 17 Asia: Bulls Hold $4,330, Eye $4,350 and $4,400
Gold is holding steady just above the $4,330 mark during the Asian session on Wednesday, after Tuesday’s decisive bullish breakout from a narrow consolidation range. The XAU/USD pair is trading near $4,337, well supported by a rising 20‑period EMA and a macro environment that continues to favor further upside. The gold trading setup June 17 Asia presents a clear opportunity, but patience is required as the market braces for the first Federal Reserve decision under Chairman Warsh. While the dip‑buyers remain active, the immediate push toward $4,350 and $4,400 will likely depend on how the FOMC statement shapes real yield expectations later today.
Our AI‑powered Gold trading bot identified a high‑probability buy signal overnight but held back due to proximity to a recent entry — exactly the kind of disciplined risk control that keeps its win rate above 83%.
Gold Market Overview
The broader macro backdrop remains supportive for gold. Crude oil’s sharp sell‑off, triggered by hopes of a US‑Iran peace framework, is dampening inflation expectations and chipping away at the hawkish Fed narrative. Lower real yields tend to boost the non‑yielding metal, and that dynamic is clearly alive in early Asian trade. The US Dollar Index is on the defensive, hovering near 103.50, as traders scale back bets on aggressive tightening beyond today’s meeting.
Market intelligence from FXStreet and Investing.com confirms that the US‑Iran deal is the dominant theme, reinforcing a disinflationary impulse that could keep the Fed cautious. With the Federal Funds Rate forecast unchanged at 3.75%, the focus will be on the dot plot and Chairman Warsh’s tone. A dovish lean — acknowledging easing price pressures — could send gold charging toward the $4,400 handle. The Asian session, typically the quietest of the day, is soaking up this liquidity without significant pullbacks, a testament to underlying demand.
Short‑term consolidation near the breakout point is typical ahead of a major event. For traders looking to position before the FOMC, the current stability above $4,330 offers a low‑risk launching pad, provided they respect the key reversal levels.
Technical Analysis
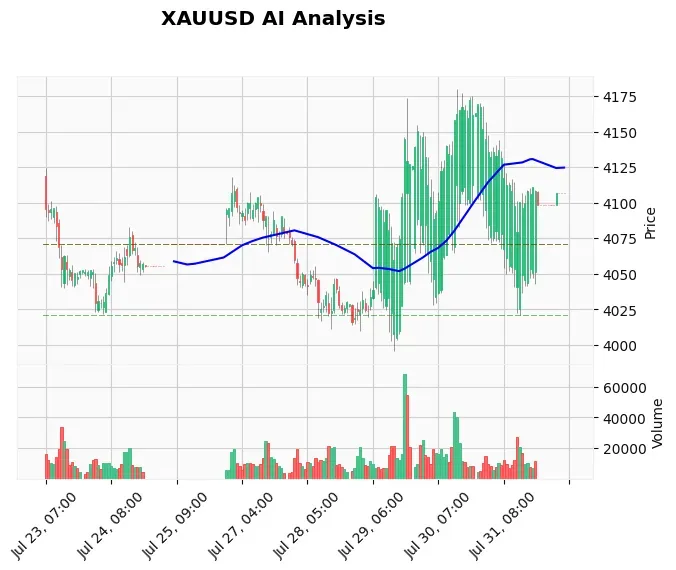
The hourly chart paints a structurally bullish picture. Price broke out of a $4,320–$4,335 rectangle earlier this week and has now built a small bull flag just below the $4,341 session high. The 20‑period EMA at $4,333.45 is sloping upward, the 50‑EMA at $4,311.37 is comfortably below, and the 200‑EMA at $4,305.03 anchors the longer‑term uptrend — a perfect bullish alignment.
Momentum gauges reinforce the setup. The 14‑period RSI reads 54.12, well inside the bullish territory but far from overbought, leaving ample room for another leg higher. The MACD line (4.57) is slightly below its signal line (6.60), suggesting a pause in momentum rather than a reversal; this often precedes a resumption move in strong trends. The Average True Range (13.85 points) implies that a $14 intraday swing is normal, so targeting $4,350 and $4,375 is realistic given the current volatility envelope.
Key support is the breakout zone $4,335–$4,330, followed by the $4,320 swing low. Below that, $4,303 (the 200‑EMA) marks the line in the sand for bulls. On the upside, $4,350 is the first psychological barrier, with $4,375 (minor swing high) and $4,400 (bull flag target) as the next objectives. A confirmed close above $4,350 would open the door to the $4,400–$4,420 band.
Fundamental Drivers
Two stories dominate the tape. First, the US‑Iran peace framework has sent oil prices tumbling, directly lowering headline inflation expectations and diminishing the case for aggressive rate hikes. Second, the imminent FOMC decision — the first under Chairman Warsh — carries substantial event risk. Although the rate is expected to stay at 3.75%, the statement and revised economic projections will set the tone for the summer. A cautious, data‑dependent Fed would be gold‑positive, as it implies a slower path to normalization.
Beyond the immediate headlines, China’s PBOC set the USD/CNY fix at 6.7659, slightly weaker, which can be mildly supportive for physical gold demand. Housing data from the US missed expectations, another soft patch that feeds the dovish narrative. For traders who want to automate their news‑based strategies, our high‑impact news trading bot is configured to exploit exactly these Fed‑driven volatility spikes on XAU/USD.
Devil’s Advocate
No trade is without risk, especially with the FOMC minutes away. A hawkish surprise — perhaps a more upbeat dot plot or a direct warning about lingering inflation — could rapidly undo the bullish structure. A break below $4,320 would negate the breakout and likely trigger a slide toward $4,300–$4,290, the weekly pivot. Moreover, the MACD histogram is slightly negative, a subtle divergence that warns of possible exhaustion if buy‑side volume dries up. Keep an eye on the $4,335 level: an hourly close below it intraday would be the first sign that bulls are losing grip.
Trading Strategy for This Session
The Asian session offers a calm window to set up a position for the European and US volatility. The highest probability entry is on a dip into the $4,330–$4,335 support band, allowing traders to lean against the breakout zone. A stop‑loss just below $4,319 — slightly beneath the $4,320 swing low — risks about 16–21 points, while targeting $4,350 for a 1:1.5 risk‑reward initially. Aggressive traders can trail stops once $4,350 is breached, targeting $4,375 and ultimately $4,400.
Those who prefer fully automated execution can rely on our SMC‑powered Price Action Pro EA, which identifies smart money footprints around these very breakout levels and executes with predefined risk parameters.
Risk Management
With the FOMC event on the horizon, avoid over‑leveraging. Position sizing should be kept to 1–2% of account equity per trade, and consider widening stops slightly to account for ATR‑based noise. If the trade goes against you and $4,320 snaps, step aside and wait for the $4,300 retest. Rushing back into the market after a loss, especially on a news day, is a common pitfall. For seamless 24/7 execution without downtime, a low‑latency Windows VPS ensures your orders are processed the moment they are triggered, even during Asian afternoon lulls.
Frequently Asked Questions
What is the gold price today in Asia?
Gold is trading around $4,337 early on June 17, 2026, holding gains above the $4,330 breakout level after Tuesday’s rally. The market is consolidating ahead of the US Federal Reserve decision later in the day.
Is XAU/USD bullish or bearish right now?
The short‑term bias is bullish. The price is above its 20, 50, and 200‑hour EMAs, RSI is above 50, and the market has just cleared a multi‑day consolidation zone. The path of least resistance points to $4,350 and $4,400, provided the FOMC does not deliver a hawkish shock.
What are the key support and resistance levels for gold today?
Immediate support is $4,335–$4,330, with stronger demand at $4,320 and $4,303. Resistance is at $4,350 (psychological), $4,375 (minor high), and the measured move target of $4,400. A break below $4,320 would invalidate the bullish outlook.
How does the FOMC meeting affect gold trading?
Federal Reserve meetings often cause sharp volatility in gold. A dovish stance — hinting at slower rate hikes — typically weakens the dollar and real yields, driving gold higher. A hawkish shift can trigger knee‑jerk selling, especially if the market has priced in a benign outcome.
Gold trading setup June 17 Asia: What’s Next
Gold is holding the $4,330 level with quiet confidence as Asia passes the baton to Europe. The breakout structure is intact, and the fundamental stars are aligned — falling oil, a vulnerable dollar, and a Fed that cannot afford to sound too aggressive. While the proximity filter kept our AI bot from pulling the trigger just yet, the manual setup for traders is clear: buy dips toward $4,330–$4,335, stop at $4,319, and aim for $4,350 initially. The real firework will come during the FOMC release, but those who position cautiously now can ride the momentum from a safer distance.
If you’d rather not watch the charts all night, our AI Trading Bot handles every entry, stop‑loss, and take‑profit automatically on XAU/USD — filtering out noise, respecting proximity rules, and consistently delivering an 83%+ win rate. Let the bot do the heavy lifting while you sleep.
Risk Disclaimer: Trading Gold (XAU/USD) involves significant risk of loss. This content is for informational purposes only and does not constitute financial advice. Always conduct your own research and trade responsibly.