Gold Price Today June 22 2026 Europe: Bears Test $4,200 Support
Gold price today June 22 2026 Europe finds XAUUSD hovering just above the $4,200 threshold, with price action holding minor intraday gains near $4,191 despite a broader bearish undertone. Sliding oil prices have offered a fleeting boost, but the weight of a resurgent US dollar and hawkish Federal Reserve expectations keeps the upside in check. Traders are watching the $4,200 psychological barrier closely—a sustained break below could unleash the next leg lower, while any rebound faces layered resistance. Our AI analysis log confirms an existing sell trade near $4,202 remains valid, targeting a move to $4,180. With the Core PCE Price Index due Thursday, the market is bracing for a potential shakeout.
Want to trade this Gold setup without staring at screens? Our AI Trading Bot runs 24/7 with an 83%+ win rate on XAUUSD.
Gold Market Overview
European morning action unfolds with a cautiously defensive tone for gold. Despite a short-lived bounce during early Monday trading, the yellow metal remains pinned below critical moving averages, reflecting the dominant bearish sentiment. The DXY is trading near 104.60, a level that typically pressures gold. With the US 10-year yield holding above 4.40%, the opportunity cost of holding non-yielding bullion rises, further dampening demand. Geopolitical tensions in the Middle East have eased markedly after positive Iran nuclear talks, removing another tailwind for gold.
The macro backdrop is mixed: easing oil prices due to progress in US-Iran negotiations reduces inflation fears, offering a soft floor for gold, but that same geopolitical de-escalation undercuts the metal’s risk premium. Meanwhile, central bank structural demand, as noted by Goldman Sachs’ report of 59 tonnes purchased in April, provides a long-term underpinning, but near-term momentum aligns with the bears.
Technical Analysis
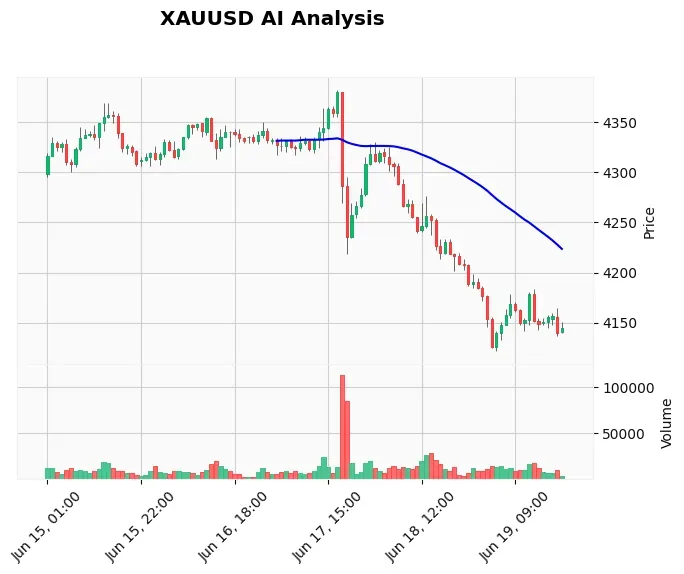
From a technical lens, XAUUSD’s 60-minute chart confirms the Daily bearish trend. Price is trading at $4,190, sandwiched between the 20-period EMA at $4,179.78 and the 50-period EMA at $4,205.83. The 200-period EMA sits far above at $4,266.88, establishing the broad bearish structure. RSI at 51.99 is dead neutral, offering no immediate overbought/oversold signal, while the MACD at -2.43 and its signal line at -9.68 keep the momentum on the bearish side.
ATR stands at 20.31, implying a roughly $20 intraday range, which aligns with the $4,188 low to $4,202 high observed. A close below the $4,188 low would activate the bearish flag pattern, projecting a measured move to $4,150. The weekly supports at $4,023.76 and $4,268.53 serve as long-term references, but for today’s session, the battleground is at $4,205 resistance and $4,188 support.
Our AI analysis notes an M15 surge, suggesting a corrective bounce. This retracement does not break the daily downtrend, so patience is warranted. (Chart available)
Fundamental Drivers
The fundamental picture leans bearish. The US dollar has strengthened broadly after the hawkish Fed update, and markets are now pricing in higher-for-longer rates. Data from Investing.com shows that traders now assign a 35% probability of a July rate hike, up from 20% a week ago, underscoring the hawkish shift. FXStreet points out that USD/JPY continues its ascent, and US-Iran diplomacy progress is weighing on oil and, by extension, gold’s inflation-hedge appeal. The upcoming Core PCE Price Index on Thursday is the next major event; a hotter reading could cement the hawkish tilt and drive gold below $4,150.
On the other hand, Goldman Sachs’ structural gold buying narrative is notable, with central bank purchases acting as a strategic floor. But such structural forces rarely dictate intraday swings. For now, the near-term drivers—USD strength, hawkish bets, and geopolitical de-escalation—are pressuring gold from the top. Keep an eye on the US economic calendar; any miss on PCE could spark a sharp but likely temporary bounce.
If you trade the news, our News Trading Bot automatically scales into high-impact Gold events like PCE.
Devil's Advocate
What could derail the bearish call? A dovish surprise in PCE data or a sudden escalation in geopolitical tensions (e.g., Hormuz Strait disruptions) could trigger a sharp short squeeze. Technically, if price reclaims the $4,205 EMA50 and closes above it on the hourly chart, bears would lose conviction, and the metal could rally toward $4,220 or even $4,240. The $4,188 low must hold or the bearish thesis stands intact.
Trading Strategy for This Session
The prevailing strategy remains a sell on rallies. A more conservative approach is to wait for the M15 surge to lose steam near $4,205 before committing. The AI model maintains a SELL trade from $4,202 with a stop loss at $4,225 and take profit at $4,180. This zone around $4,200 offers a decent risk-reward entry for those not yet in the trade. Aggressive traders could wait for a bounce to $4,205-$4,210 with confirmation of rejection before entering. A break below $4,188 opens the door for an extended target near $4,165, while a daily close below $4,180 would confirm a deeper move. If the sell trade is triggered, consider reducing risk once price approaches $4,180 to lock in profits.
For those who prefer automated execution, our Price Action Pro EA can manage these levels around the clock based on SMC concepts.
Risk Management
Effective risk control is essential when trading near key psychological levels. With a stop loss of $23 above entry, any trade should risk no more than 1-2% of capital. Using the ATR of $20, a stop at $4,225 represents roughly 1.2 ATR, which is reasonable. If that’s too wide, consider reducing position size. The risk-reward ratio from $4,202 to $4,180 is about 1:0.73—tight but feasible if price momentum follows through. Always adjust lot size to keep risk constant. Trailing stop-loss to breakeven after a 10-dollar move in your favor is prudent. Automated systems need reliable hosting; our Windows VPS for Gold trading ensures 24/7 uptime.
Frequently Asked Questions
What is the gold price doing in Europe on June 22?
Gold is trading near $4,190, holding minor gains but struggling below $4,205 resistance, pressured by a strong US dollar and hawkish Fed expectations.
Why is gold bearish today despite lower oil?
Lower oil reduces inflation fears, but the stronger USD and hawkish Fed overshadow that support, keeping the bias bearish.
Where is the next support for XAUUSD?
Immediate support lies at $4,188, with a break targeting $4,180 and potentially $4,165. The next major floor is the weekly support at $4,023, though unlikely to be tested today.
How can I trade gold ahead of PCE data?
Watch for a rejection at $4,205 to enter short, with a stop above $4,225. Alternatively, an automated news trading bot can handle the volatility.
Conclusion
The European session is shaping up as a critical test for gold bulls. With $4,200 holding by a thread and every rally being sold into, the bearish case remains robust. The combination of technical breakdown signals, a hawkish Fed, and a rising USD makes a move toward $4,180—and potentially lower—the path of least resistance. However, the M15 bounce warrants caution; any close above $4,205 would flip the short-term bias. Remember, the weekly chart still points lower, so intraday bounces are selling opportunities. Stay nimble, manage risk, and let the levels guide your entries.
Don’t miss the next breakdown in XAUUSD. Let our Cloud Copy Trading service mirror top Gold traders automatically, emotion-free, and proven.
Trading Gold (XAU/USD) involves significant risk of loss. This content is for informational purposes only and does not constitute financial advice. Always conduct your own research and trade responsibly.