How to Use Central Bank Buying in Gold Trading: A Complete 2026 Guide
Gold just broke past $4,300. You saw the headlines—China, India, and Poland are hoarding physical bullion at a pace not seen in decades. For the retail trader, the question is simple: can you use this central bank frenzy to profit in XAU/USD? Absolutely. Central bank buying is the silent engine behind this multi‑year bull run, and once you understand how to read the data, you can align your trades with the smartest “whales” in the market. Our AI Trading Bot already incorporates macro flows like these—let’s break down exactly how you can do it manually and profitably.
What Is Central Bank Buying of Gold?
Central bank buying is the purchase of physical gold by a country’s monetary authority to be held as part of its official reserves. Unlike speculators or hedge funds, central banks are not chasing quick returns. They buy gold to diversify away from US dollar assets, hedge against geopolitical risks, and strengthen their sovereign balance sheets. Historically, gold made up a small fraction of total reserves, but after the Russian sanctions in 2022 and the shifting global monetary order, central banks—especially those in BRICS+ nations—started accumulating gold at an unprecedented rate.
In 2023, central banks added over 1,000 tonnes to their vaults, and that trend only accelerated into 2024–2026. These are long‑term, strategic positions, not trading positions. That permanence makes central bank demand a powerful, reliable undercurrent in the gold market.
Why Central Bank Buying Matters for Gold Traders
Central banks are the ultimate buy‑and‑hold investors. When they step into the market, they absorb available supply without regard for short‑term price swings. This creates three concrete effects that every gold trader must understand:
1. A Hard Floor Under Price: Persistent central bank buying makes deep selloffs rare. Even during risk‑on rallies or a strong US dollar, gold’s downside is limited because central banks stand ready to purchase on any decent dip.
2. Regime Change in Sentiment: When the world’s largest financial institutions vote with their pocketbooks, it validates the narrative that gold is no longer just a crisis hedge but a structural asset shift. This brings fresh long‑term capital of all types into gold.
3. Disconnect from Traditional Correlations: You may have noticed gold rising alongside a strong DXY. Central bank buying explains part of this anomaly. When sovereign funds convert local currency to dollars then to physical metal, the normal inverse relationship weakens, giving you more reliable uptrends.
How to Use Central Bank Buying Data in Your Trading (Step by Step)
Now, let’s turn theory into action. Here is a practical framework to integrate central bank flows into your XAU/USD decision‑making.
Step 1: Monitor the Right Data Sources
The World Gold Council (WGC) publishes quarterly reports on central bank holdings, but that’s slow. For more timely signals, follow IMF data releases, central bank press conferences, and specialized gold news feeds. Countries like China, India, Turkey, and Poland are the most transparent drivers. Mark your calendar for the WGC’s quarterly “Gold Demand Trends” and major IMF reserve updates—these often cause intraday volatility.
Step 2: Identify the Directional Bias
If central banks have been net buyers for six consecutive months while other demand sources are flat, you have a structural bullish bias. On the daily chart, this means you should be looking for buying opportunities on pullbacks, not trying to call a top. For example, even as gold reached $4,300 in 2026, net buying by central banks remained positive—that is a clear signal the trend is intact.
Step 3: Combine with Technical Levels
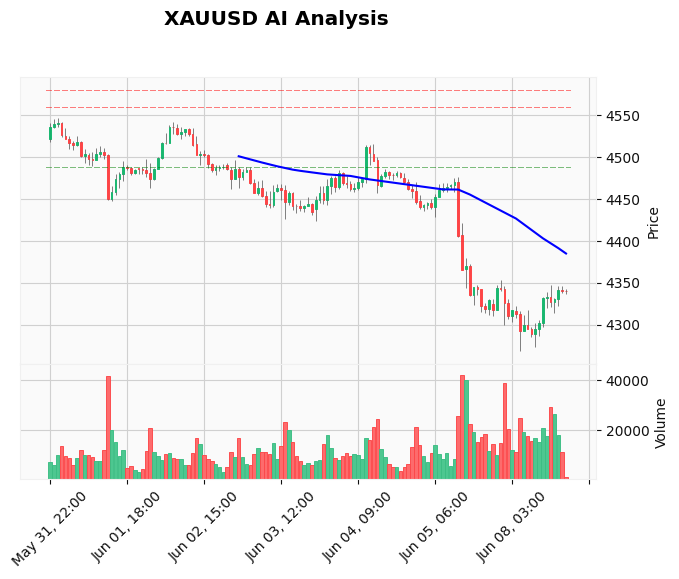
Use central bank data to confirm your technical reads. If price retests a major support level and you see that China’s reserves just rose by another 10 tonnes, that support is far more likely to hold. In today’s market, with XAU/USD at $4,338, our AI Analysis flagged a WAIT signal with a stop loss at $4,355 and a take profit at $4,320. That pullback scenario aligns with the fundamental reality: central banks are likely buyers at $4,300–$4,320, so a long entry there carries a high‑probability edge.
Step 4: Act on the Data as a Filter, Not a Timer
Central bank buying is a monthly trend, not a 5‑minute entry signal. Use it as a filter: only consider long trades when the quarterly trend is positive. Never short gold while central banks are aggressively accumulating, no matter how tempting a bearish chart pattern looks. The “news event” moment—like a surprise jump in Polish reserves—can accelerate a breakout, so having a limit order just above nearby resistance can produce quick gains.
Step 5: Automate the Process
Since central bank data is released sporadically, you can’t sit at the screen all day. A tool like the News Trading Bot can scan for key data releases and execute trades within milliseconds, removing emotion and lag from the equation.
Common Mistakes Gold Traders Make When Using Central Bank Buying Data
1. Using It As a Day‑Trading Signal: Central bank flows are the tide, not the waves. Trying to scalp based on a vague “central banks are buying” headline will only lead to frustration. Always blend the macro view with precise entry triggers.
2. Ignoring the Lag: Many official figures are reported with a two‑to‑three‑month delay. What looks like a sudden spike in buying actually happened weeks ago. Use real‑time proxies like ETF flows and COMEX futures open interest to bridge the gap.
3. Assuming All Banks Are Equal: A 20‑tonne purchase by Poland matters; a 2‑tonne purchase by Ecuador does not. Focus on the big four: China, India, Turkey, and Russia. Their combined purchases account for over 70% of the official sector demand.
4. Forgetting Other Fundamentals: Central bank buying is a piece of the puzzle, not the entire picture. Interest rates, inflation data, and equity market risk appetite still move gold in the short term. Always check the economic calendar before leaning too heavily on one datapoint.
Real Example on the XAU/USD Chart – How Central Bank Buying Defined the 2026 Trend
Take the current price action. As of June 8, 2026, gold is trading near $4,338, within a high‑level consolidation. Our internal AI Analysis Log shows a WAIT stance with a tight stop loss at $4,355 and an initial target at $4,320. That suggests a possible short‑term pullback. But zoom out to the weekly chart, and you see a relentless uptrend from $2,000 to above $4,300, largely fuelled by central bank demand.
Back in September 2025, when gold corrected 6% to $3,850, many traders panicked. Yet data later showed that China’s PBoC had bought another 15 tonnes during that dip. Those who understood the central bank narrative stayed long and saw gold surge to new all‑time highs within two months. Today, with central banks still net buyers, any drop toward $4,300–$4,320 is likely a buy‑the‑dip opportunity. A professional level‑driven strategy, such as the one embedded in our Price Action Pro EA, can systematically identify these demand zones while respecting risk limits.
FAQ
Which central banks buy the most gold?
China, India, Turkey, Poland, and Russia are currently the largest purchasers. China’s People’s Bank of China and India’s Reserve Bank of India often lead the quarterly tallies. These institutions view gold as a long‑term reserve asset and are motivated by de‑dollarisation and geopolitical diversification.
How can I track central bank gold purchases in real time?
Real‑time data is challenging, but you can piece together a real‑time picture by monitoring WGC updates, IMF statistical releases, and credible gold news outlets. Additionally, tracking physical gold import data for India and China can provide high‑frequency hints before the official numbers arrive.
Does central bank buying guarantee that gold prices will rise?
Not day to day, but over the medium to long term, sustained central bank buying creates a structural tailwind that makes sustained declines unlikely. Short‑term corrections can still occur due to interest rate moves or speculative selling, so never trade without a stop loss.
Can I trade gold based solely on central bank buying data?
You can use it as a foundational bias, but it should be combined with technical analysis and risk management. For example, if quarterly buying is strong, you might only take long signals on the daily chart, ignoring shorts entirely. But pure directional trading without entry‑timing tools usually leads to large drawdowns.
How does central bank buying affect gold’s correlation with the US dollar?
It often weakens the traditional inverse correlation. When central banks buy gold as part of a deliberate reserve diversification away from dollars, gold can rally even when the dollar is firm. That’s why we’ve seen XAU/USD hit new highs in periods of DXY strength—exactly the scenario of 2024‑2026.
Conclusion
The days of central banks being passive gold holders are over. They are now the most powerful force in the gold market, and their steady, unemotional buying provides a roadmap for patient traders. As you watch XAU/USD hover near $4,338, remember that every dip into the $4,300 zone is being quietly absorbed. Build a trading plan that respects central bank flows as a long‑term tailwind, and you will position yourself with the institutional giants instead of against them. For a completely hands‑off way to execute that plan, our AI Trading Bot monitors these macro conditions around the clock so you never miss a major opportunity.
Trading Gold (XAU/USD) involves significant risk of loss. This content is for informational purposes only and does not constitute financial advice. Always conduct your own research and trade responsibly.